

Prediction and clinical utility of a contralateral breast cancer risk model
- PMID: 31847907
- PMCID: PMC6918633
- DOI: 10.1186/s13058-019-1221-1
Prediction and clinical utility of a contralateral breast cancer risk model
Abstract
Background: Breast cancer survivors are at risk for contralateral breast cancer (CBC), with the consequent burden of further treatment and potentially less favorable prognosis. We aimed to develop and validate a CBC risk prediction model and evaluate its applicability for clinical decision-making.
Methods: We included data of 132,756 invasive non-metastatic breast cancer patients from 20 studies with 4682 CBC events and a median follow-up of 8.8 years. We developed a multivariable Fine and Gray prediction model (PredictCBC-1A) including patient, primary tumor, and treatment characteristics and BRCA1/2 germline mutation status, accounting for the competing risks of death and distant metastasis. We also developed a model without BRCA1/2 mutation status (PredictCBC-1B) since this information was available for only 6% of patients and is routinely unavailable in the general breast cancer population. Prediction performance was evaluated using calibration and discrimination, calculated by a time-dependent area under the curve (AUC) at 5 and 10 years after diagnosis of primary breast cancer, and an internal-external cross-validation procedure. Decision curve analysis was performed to evaluate the net benefit of the model to quantify clinical utility.
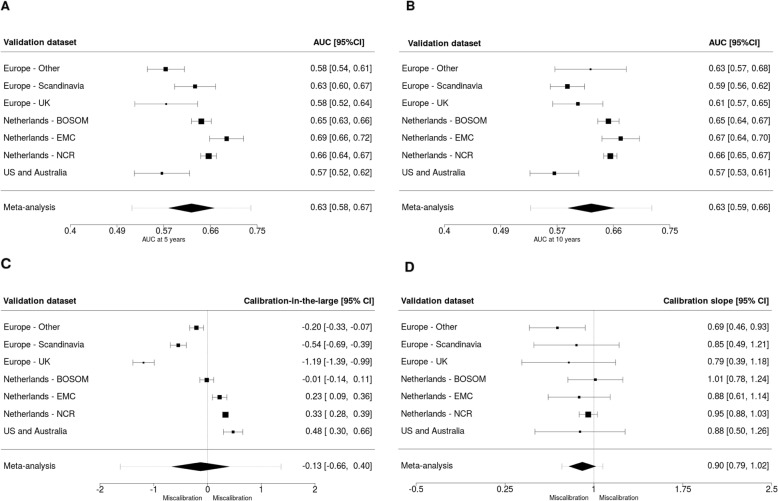
Results: In the multivariable model, BRCA1/2 germline mutation status, family history, and systemic adjuvant treatment showed the strongest associations with CBC risk. The AUC of PredictCBC-1A was 0.63 (95% prediction interval (PI) at 5 years, 0.52-0.74; at 10 years, 0.53-0.72). Calibration-in-the-large was -0.13 (95% PI: -1.62-1.37), and the calibration slope was 0.90 (95% PI: 0.73-1.08). The AUC of Predict-1B at 10 years was 0.59 (95% PI: 0.52-0.66); calibration was slightly lower. Decision curve analysis for preventive contralateral mastectomy showed potential clinical utility of PredictCBC-1A between thresholds of 4-10% 10-year CBC risk for BRCA1/2 mutation carriers and non-carriers.
Conclusions: We developed a reasonably calibrated model to predict the risk of CBC in women of European-descent; however, prediction accuracy was moderate. Our model shows potential for improved risk counseling, but decision-making regarding contralateral preventive mastectomy, especially in the general breast cancer population where limited information of the mutation status in BRCA1/2 is available, remains challenging.
Keywords: BRCA mutation carriers; Clinical decision-making; Contralateral breast cancer; Risk prediction model.
Conflict of interest statement
The authors declare that they have no competing interests.
Figures


References
-
- Survival and prevalence of cancer. https://www.cijfersoverkanker.nl. Accessed Mar 2019.
-
- Schaapveld M, Visser O, Louwman WJ, Willemse PH, de Vries EG, van der Graaf WT, Otter R, Coebergh JW, van Leeuwen FE. The impact of adjuvant therapy on contralateral breast cancer risk and the prognostic significance of contralateral breast cancer: a population based study in the Netherlands. Breast Cancer Res Treat. 2008;110(1):189–197. doi: 10.1007/s10549-007-9709-2. - DOI - PMC - PubMed
-
- van den Broek AJ, van ‘t Veer LJ, Hooning MJ, Cornelissen S, Broeks A, Rutgers EJ, Smit VT, Cornelisse CJ, van Beek M, Janssen-Heijnen ML, et al. Impact of age at primary breast cancer on contralateral breast cancer risk in BRCA1/2 mutation carriers. J Clin Oncol. 2016;34(5):409–418. doi: 10.1200/JCO.2015.62.3942. - DOI - PubMed
Publication types
MeSH terms
Substances
Grants and funding
- C1275/A19187/CRUK_/Cancer Research UK/United Kingdom
- C490/A16561/CRUK_/Cancer Research UK/United Kingdom
- C490/A10124/CRUK_/Cancer Research UK/United Kingdom
- C1275/A11699/CRUK_/Cancer Research UK/United Kingdom
- 16563/CRUK_/Cancer Research UK/United Kingdom
- C1275/A15956/CRUK_/Cancer Research UK/United Kingdom
- UM1 CA164920/CA/NCI NIH HHS/United States
- 10118/CRUK_/Cancer Research UK/United Kingdom
- C1287/A10118/CRUK_/Cancer Research UK/United Kingdom
- C1275/C22524/CRUK_/Cancer Research UK/United Kingdom
- C1287/A16563/CRUK_/Cancer Research UK/United Kingdom
- 16561/CRUK_/Cancer Research UK/United Kingdom
- 10124/CRUK_/Cancer Research UK/United Kingdom
LinkOut - more resources
Full Text Sources
Medical
Research Materials
Miscellaneous
