. 2020 Mar 15;26(6):1420-1431.
doi: 10.1158/1078-0432.CCR-19-2625. Epub 2019 Dec 17.

Inhibition of MDSC Trafficking with SX-682, a CXCR1/2 Inhibitor, Enhances NK-Cell Immunotherapy in Head and Neck Cancer Models

Affiliations

Inhibition of MDSC Trafficking with SX-682, a CXCR1/2 Inhibitor, Enhances NK-Cell Immunotherapy in Head and Neck Cancer Models

Sarah Greene et al. Clin Cancer Res. .

Abstract

Purpose: Natural killer (NK)-cell-based immunotherapy may overcome obstacles to effective T-cell-based immunotherapy such as the presence of genomic alterations in IFN response genes and antigen presentation machinery. All immunotherapy approaches may be abrogated by the presence of an immunosuppressive tumor microenvironment present in many solid tumor types, including head and neck squamous cell carcinoma (HNSCC). Here, we studied the role of myeloid-derived suppressor cells (MDSC) in suppressing NK-cell function in HNSCC.

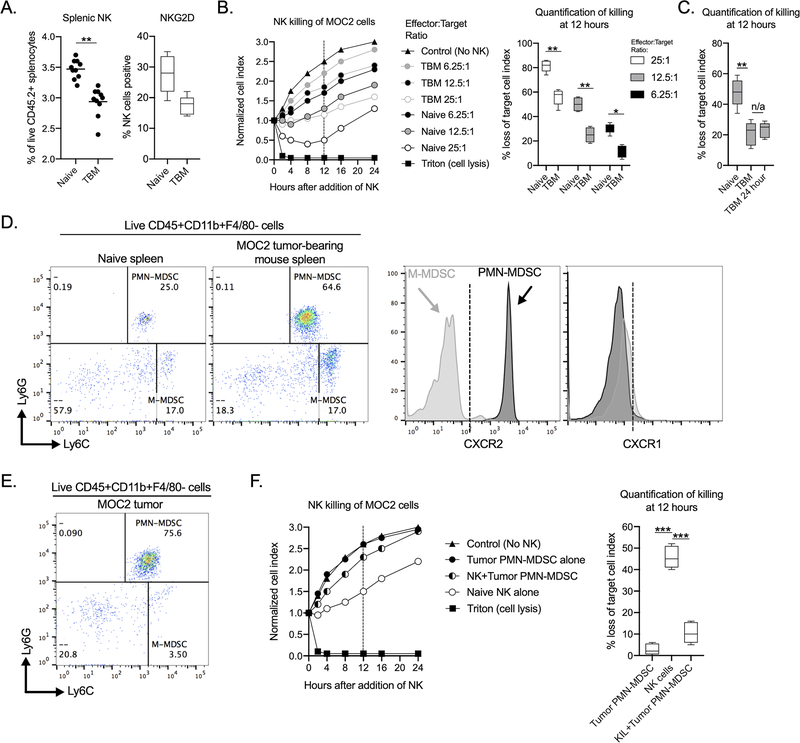
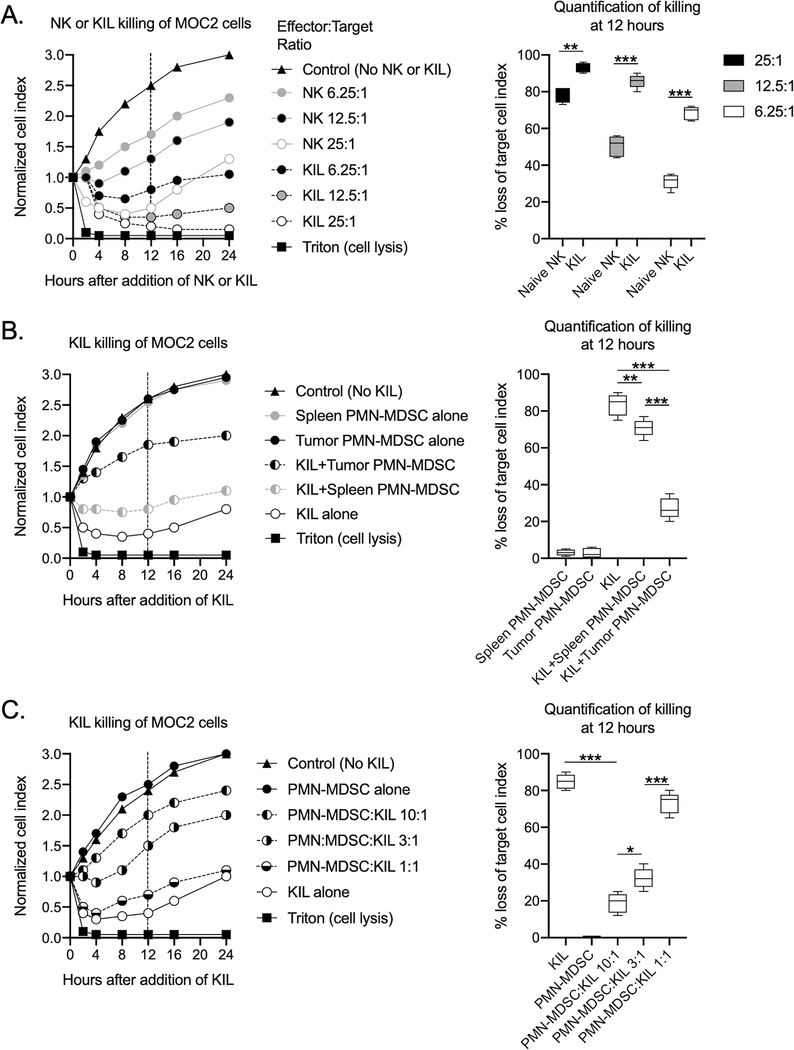
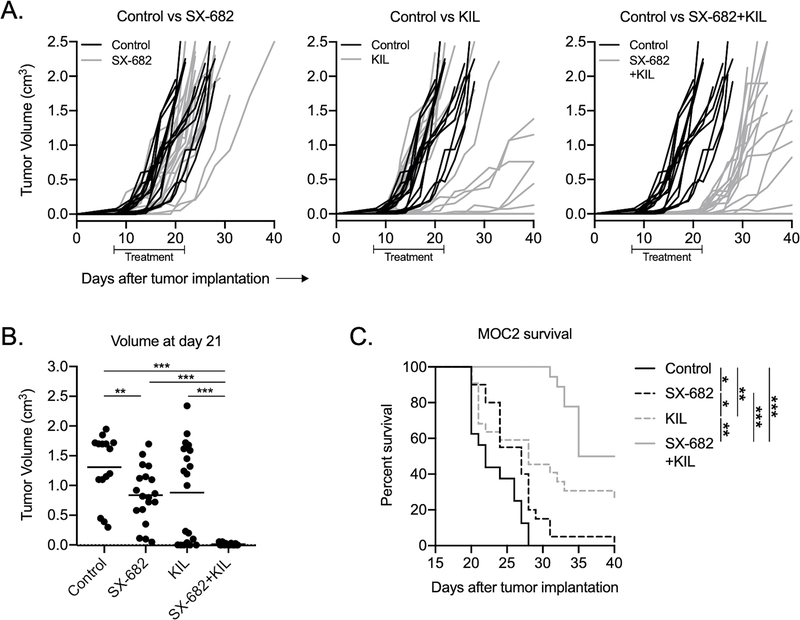
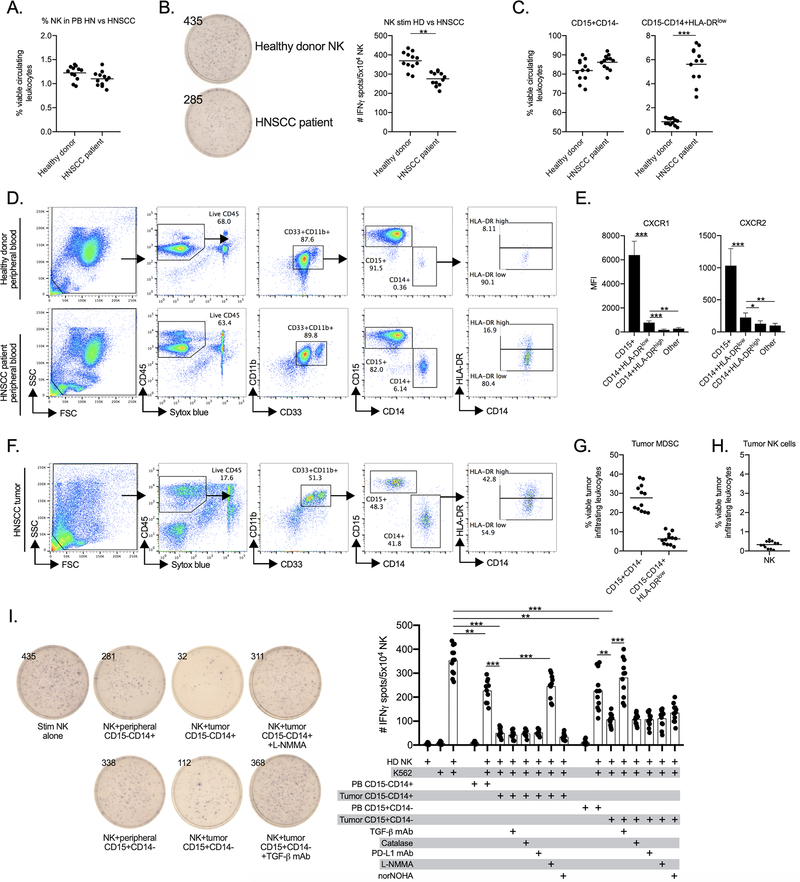
Experimental design: The ability of peripheral and tumor-infiltrating MDSC from mice bearing murine oral cancer 2 (MOC2) non-T-cell-inflamed tumors and from patients with HNSCC to suppress NK-cell function was studied with real-time impedance and ELISpot assays. The therapeutic efficacy of SX-682, a small-molecule inhibitor of CXCR1 and CXCR2, was assessed in combination with adoptively transferred NK cells.

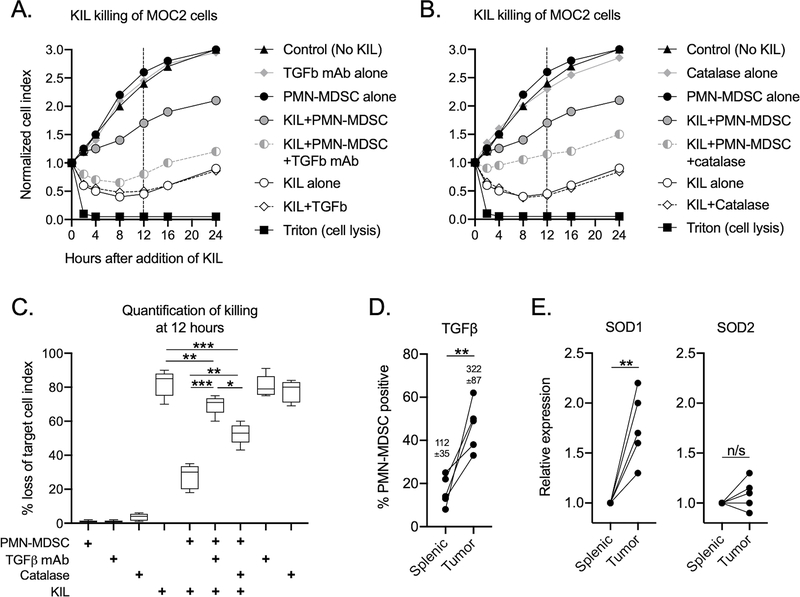
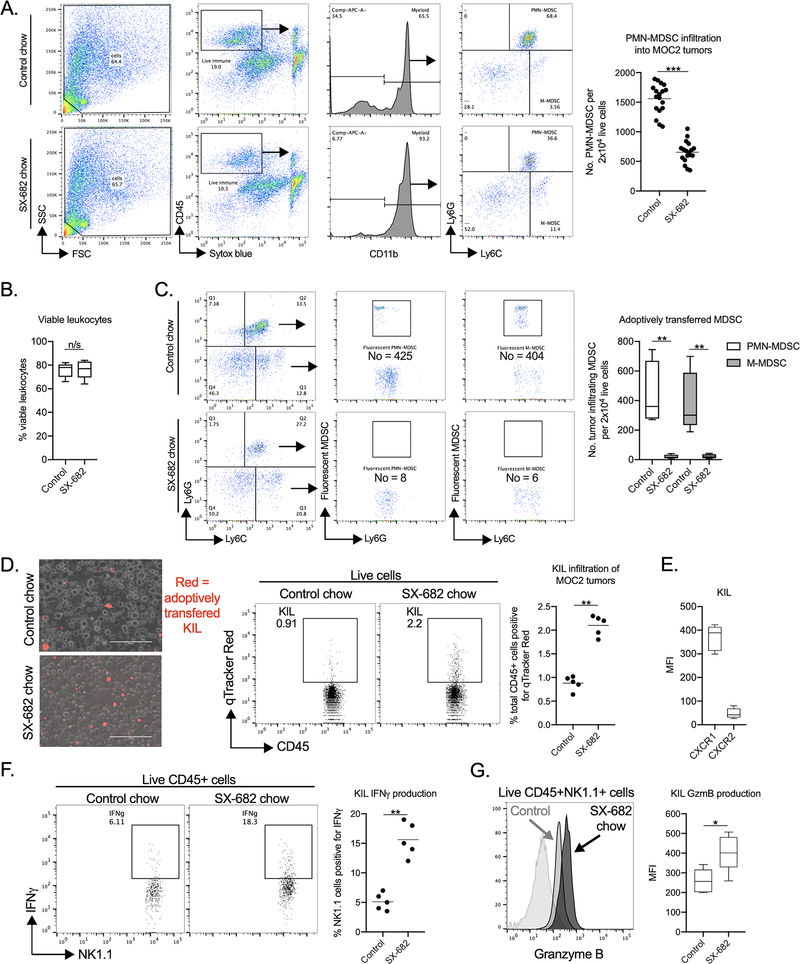
Results: Mice bearing MOC2 tumors pathologically accumulate peripheral CXCR2+ neutrophilic-MDSC (PMN-MDSC) that traffic into tumors and suppress NK-cell function through TGFβ and production of H2O2. Inhibition of MDSC trafficking with orally bioavailable SX-682 significantly abrogated tumor MDSC accumulation and enhanced the tumor infiltration, activation, and therapeutic efficacy of adoptively transferred murine NK cells. Patients with HNSCC harbor significant levels of circulating and tumor-infiltrating CXCR1/2+ CD15+ PMN-MDSC and CD14+ monocytic-MDSC. Tumor MDSC exhibited greater immunosuppression than those in circulation. HNSCC tumor MDSC immunosuppression was mediated by multiple, independent, cell-specific mechanisms including TGFβ and nitric oxide.

Conclusions: The clinical study of CXCR1/2 inhibitors in combination with adoptively transferred NK cells is warranted.


Conflict of interest statement

Conflicts of interest: JZ and DM are employees of Syntrix Pharmaceuticals. Otherwise the authors declare no potential conflicts of interest.

Figures

Figure 1.
Figure 1.. MOC2 tumor bearing mice accumulated PMN-MDSC and dysfunctional NK cells
Spleens from non-tumor bearing (naïve) or day 10 MOC2 tumor bearing wild-type B6 mice (TBM) were assessed for NK cell accumulation (A) or NKG2D cell surface expression (B) by flow cytometry (n=10). B, Splenic NK cells from naïve or day 10 MOC2 tumor bearing mice were isolated via magnetic selection and assessed for their ability to kill MOC2 tumors cells at different E:T ratios via impedance analysis. Representative impedance plot shown on the left, with quantification of NK killing of MOC2 cells at 12 hours on the right. C, NK cells were isolated as in B, incubated for 24 hours, and quantification of MOC2 killing by impedance analysis was performed with quantification at 12 hours shown. D, Spleens from naïve and day 10 MOC2 tumor bearing mice were assessed for myeloid cells by flow cytometry. Representative dot plots of live, CD45.2+CD11b+F4/80 myeloid cells are shown (frequencies shown represent frequencies of this myeloid cell gate). PMN-MDSC were defined as Ly6GhiLy6Cint and M-MDSC as Ly6GlowLy6Chi. To the right are representative histograms of chemokine receptor expression on MDSC subsets. E, Representative dot plot of live, CD45.2+CD11b+F4/80 myeloid cells from a day 10 MOC2 tumor. F, PMN-MDSC (PMN-MDSC-to-NK ratio of 3:1) isolated from MOC2 tumors were assessed for their ability to suppress the ability of isolated splenic NK cells to kill MOC2 tumor cells (NK-to-MOC2 ratio of 10:1) via impedance analysis. Representative impedance plot shown on the left, with quantification of NK killing of MOC2 cells at 12 hours on the right (n=5). All representative data shown from one of at least three independent experiments with similar results. *, p<0.05; **, p<0.01; ***, p<0.001
Figure 2.
Figure 2.. Tumor PMN-MDSC suppressed the effector function of KIL cells
A, Isolated splenic NK cells and KIL were assessed for their ability to kill MOC2 tumors cells at different E:T ratios via impedance analysis. Representative impedance plot on the left, with quantification of NK killing of MOC2 cells at 12 hours on the right. B, KIL were assessed for their ability to kill MOC2 tumors cells (NK-to-MOC2 ratio of 10:1) in the presence of isolated splenic or tumor PMN-MDSC at a PMN-MDSC-to-KIL ration of 3:1 via impedance analysis. Representative impedance plot on the left, with quantification of NK killing of MOC2 cells with or without PMN-MDSC at 12 hours on the right. C, PMN-MDSC isolated from MOC2 tumors were assessed for their ability to inhibit KIL killing of MOC2 tumor cells (NK-to-MOC2 ratio of 10:1) over a range of PMN-MDSC-to-KIL ratios. Representative impedance plot on the left, with quantification of NK killing of MOC2 cells with or without PMN-MDSC at 12 hours on the right. All representative data shown from one of at least three independent experiments with similar results. *, p<0.05; **, p<0.01; ***, p<0.001
Figure 3.
Figure 3.. Tumor PMN-MDSC inhibited KIL effector function through TGFβ and H2O2
PMN-MDSC isolated from MOC2 tumors (PMN-MDSC-to-NK ratio of 3:1) were assessed for their ability to inhibit KIL killing of MOC2 tumor cells (NK-to-MOC2 ratio of 10:1) in the presence or absence of TGFβ neutralizing antibody (A) or the H2O2 inhibitor catalase (B). Representative impedance plots shown. C, quantification of NK killing of MOC2 cells with or without PMN-MDSC and inhibitors at 12 hours. Quantification of cell surface TGFβ expression by flow cytometry (D) or SOD1/2 expression by qPCR (E) was determined for splenic or tumor infiltrating PMN-MDSC. All representative data shown from one of two independent experiments with similar results. **, p<0.01; ***, p<0.001
Figure 4.
Figure 4.. SX-682 inhibited PMN-MDSC trafficking and enhanced tumor infiltration and activation of adoptively transferred KIL
A, MOC2 tumor bearing mice were treated with SX-682 starting at day 7. At day 14, tumor single cell suspensions were assessed for live, CD45.2+CD11b+F4/80 myeloid cells by flow cytometry. Representative dot plots of gating strategy shown on the left, quantification (n=18) shown on the right. B, viability of CD45.2+ tumor leukocytes was determined by flow cytometry, quantification (n=18) shown. C, splenic PMN-MDSC or M-MDSC isolated from day mice bearing 14 day-old MOC2 tumors were fluorescently labelled and adoptively transferred (1×10⁷ MDSC/mouse, n=5) into mice bearing 15 day-old MOC2 tumors treated with control or SX-682 chow beginning on day 7. Tumors were harvested and analyzed by flow cytometry 18 hours after adoptive transfer. Representative dot plots shown on the left, quantification of the number of fluorescently labelled MDSC that trafficked into tumors shown on the right. D, KIL were fluorescently labelled and adoptively transferred into day 10 MOC2 tumors in mice treated with or without SX-682 beginning at day 7. Four hours after injection of KIL, tumor single cell suspensions were assessed for KIL infiltration via fluorescent imaging (left panels) or flow cytometry. Representative dot plots are shown, with quantification (n=5) shown on the right. KIL were adoptively transferred into day 10 MOC2 tumors in mice treated with or without SX-682 beginning at day 7. E, CXCR1 and CXCR2 expression on KIL cells was assessed by flow cytometry, quantification shown. Twenty-four hours after injection, enriched leukocytes obtained via density gradient from MOC2 tumor single cell suspensions were assessed for IFNγ (F) or granzyme B (G) positivity following stimulation (PMA/Iono with brefeldin) by flow cytometry. Representative dot plots or histograms are shown on the left, with quantification (n=5) shown on the right. All representative data shown from one of at least two independent experiments with similar results. *, p<0.05; **, p<0.01; ***, p<0.001
Figure 5.
Figure 5.. Inhibition of PMN-MDSC trafficking enhanced the efficacy of adoptively transferred KIL in mice bearing MOC2 tumors
A, Wild-type C57BL/6 mice harboring MOC2 tumors were treated with SX-682 (starting day 7, treatment for 7 days) alone or in combination with adoptively transferred KIL (starting day 7, 5×10⁶ cells three times weekly for 2 weeks) and assessed for primary tumor growth (n=18–20 mice/group). Each line represents individual tumor growth. B, Day 20 tumor volumes for each treatment condition. C, Survival of treated MOC tumor-bearing mice, Kaplan-Meier survival curve shown. Cumulative data from three independent experiments shown. *, p<0.05; **, p<0.01; ***, p<0.001
Figure 6.
Figure 6.. HNSCC patient peripheral blood and tumors harbor CD15+ and CD14+ MDSC that suppress NK cells through multiple mechanisms
A, peripheral blood from patients with advanced HNSCC or healthy donors (n=12) was assessed for circulating NK cells by flow cytometry. B, sorted peripheral NK from HNSCC patients or healthy donors (n=12) were stimulated and assessed for IFNγ production by ELISpot. Representative ELISpot well photomicrographs are shown on the left (spot counts inset), with absolute spot counts shown on the right. Peripheral blood from patients with advanced HNSCC or healthy donors (n=12) was assessed for circulating NK cells by flow cytometry. Peripheral blood CD15+CD14- and CD15-CD14HLA-DRlow myeloid cells are quantified in C. Gating strategy and representative dot plots are shown in D. E, MFI of CXCR1 and CXCR2 expression on HNSCC patient peripheral blood (n=10) myeloid cells and NK cells. Other cells indicates B and T lymphocytes. F, HNSCC tumor single cell suspensions were assessed for infiltration of myeloid cells by flow cytometry. Gating strategy and representative dot plots is shown. G, quantification (n=12) of CD15+CD14- and CD15-CD14+HLA-DRlow cells. H, tumor infiltration of live, CD45+CD56+CD3- NK cells was assessed by flow cytometry, quantification (n=12) is shown. I, sorted health donor NK cells were stimulated in the presence or absence of sorted CD15+CD14- or CD15-CD14+ peripheral blood or tumor infiltrating myeloid cells and assessed for IFNγ production via ELISpot assay (n=10–12). Functional inhibitors of TGF-β (TGF-β mAb), H2O2 (catalase), PD-L1 (PD-L1 mAb), NOS (L-NMMA) or arginase (norNOHA) were used in some wells. Representative ELISpot well photomicrographs are shown on the left (dot counts inset), absolute spot counts shown on the right. **, p<0.01; ***, p<0.001

References

    1. Zaretsky JM, Garcia-Diaz A, Shin DS, Escuin-Ordinas H, Hugo W, Hu-Lieskovan S, et al. Mutations Associated with Acquired Resistance to PD-1 Blockade in Melanoma. N Engl J Med 2016;375(9):819–29. - PMC - PubMed
    1. Sade-Feldman M, Jiao YJ, Chen JH, Rooney MS, Barzily-Rokni M, Eliane JP, et al. Resistance to checkpoint blockade therapy through inactivation of antigen presentation. Nat Commun 2017;8(1):1136. - PMC - PubMed
    1. McGranahan N, Rosenthal R, Hiley CT, Rowan AJ, Watkins TBK, Wilson GA, et al. Allele-Specific HLA Loss and Immune Escape in Lung Cancer Evolution. Cell 2017;171(6):1259–71. - PMC - PubMed
    1. Davis RJ, Van Waes C, Allen CT. Overcoming barriers to effective immunotherapy: MDSCs, TAMs, and Tregs as mediators of the immunosuppressive microenvironment in head and neck cancer. Oral Oncol 2016;58:59–70. - PMC - PubMed
    1. Clavijo PE, Moore EC, Chen J, Davis RJ, Friedman J, Kim Y, et al. Resistance to CTLA-4 checkpoint inhibition reversed through selective elimination of granulocytic myeloid cells. Oncotarget 2017;8(34):55804–20. - PMC - PubMed

Publication types

MeSH terms

Substances