. 2020 Feb 7;295(6):1454-1463.
doi: 10.1074/jbc.RA119.011420. Epub 2019 Dec 17.

Substrate binding in the processive cellulase Cel7A: Transition state of complexation and roles of conserved tryptophan residues

Affiliations

Substrate binding in the processive cellulase Cel7A: Transition state of complexation and roles of conserved tryptophan residues

Nanna Røjel et al. J Biol Chem. .

Abstract

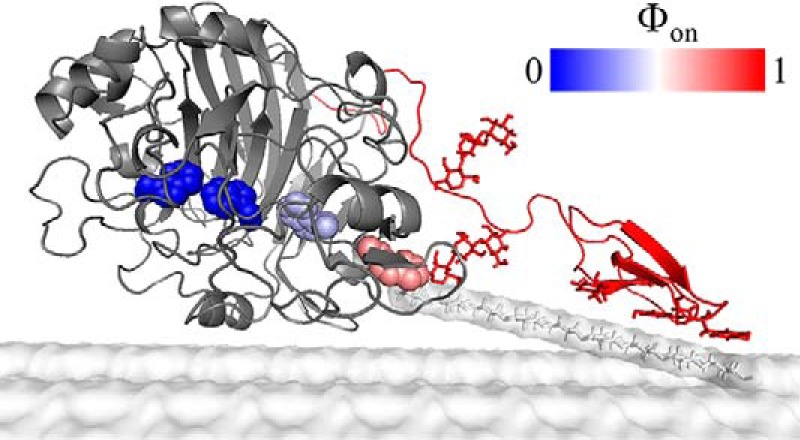
Cellobiohydrolases effectively degrade cellulose and are of biotechnological interest because they can convert lignocellulosic biomass to fermentable sugars. Here, we implemented a fluorescence-based method for real-time measurements of complexation and decomplexation of the processive cellulase Cel7A and its insoluble substrate, cellulose. The method enabled detailed kinetic and thermodynamic analyses of ligand binding in a heterogeneous system. We studied WT Cel7A and several variants in which one or two of four highly conserved Trp residues in the binding tunnel had been replaced with Ala. WT Cel7A had on/off-rate constants of 1 × 10⁵ m-1 s-1 and 5 × 10⁻³ s-1, respectively, reflecting the slow dynamics of a solid, polymeric ligand. Especially the off-rate constant was many orders of magnitude lower than typical values for small, soluble ligands. Binding rate and strength both were typically lower for the Trp variants, but effects of the substitutions were moderate and sometimes negligible. Hence, we propose that lowering the activation barrier for complexation is not a major driving force for the high conservation of the Trp residues. Using so-called Φ-factor analysis, we analyzed the kinetic and thermodynamic results for the variants. The results of this analysis suggested a transition state for complexation and decomplexation in which the reducing end of the ligand is close to the tunnel entrance (near Trp-40), whereas the rest of the binding tunnel is empty. We propose that this structure defines the highest free-energy barrier of the overall catalytic cycle and hence governs the turnover rate of this industrially important enzyme.

Keywords: Transition state; cellobiohydrolase; cellulase; complex; enzyme kinetics; fluorescence; pre-steady-state kinetics; protein engineering; thermodynamics; tryptophan.


Conflict of interest statement

T. H. S., A. M. C., and K. B. work at Novozymes, a major enzyme-producing company

Figures

Figure 1.
Figure 1.
A, a simplified illustration of the reaction mechanism of Cel7A. B, the enlargement shows the structure of the bound cellononaose ligand (green/red sticks) and the locations of the four conserved Trp residues. The numbers in the enlargement identify the subsites; the scissile bond is between subsites +1 and −1 (Protein Data Bank code 4C4C).
Figure 2.
Figure 2.
Examples of binding curves obtained from the titration experiments. Each point represents the apparent equilibrium fluorescence emission (in arbitrary units) at a given load of amorphous cellulose (RAC). The data are shown for the WT Cel7A and the W40A mutant at starting concentrations of 250 nm enzyme. The lines show the best fits of Equations 5 and 6 to the experimental data.
Figure 3.
Figure 3.
Real-time fluorescence data for the complexation of RAC and, respectively, the Cel7A WT and the W40A mutant (250 nm enzyme). The ordinate, θ, shows the fraction of enzyme molecules in an ES complex (c.f. Equation 1). Analogous data for the other enzymes are shown in Fig. S3. The black lines represent the best fit to an exponential function.
Figure 4.
Figure 4.
Initial rate of complexation, von, derived from Fig. 3 and plotted as a function of the RAC load for two enzymes, Cel7AWT and W40A. The observed proportionality supports the interpretation that the complexation is first order with respect to the load of cellulose, and the slope signifies the parameter masskonE0 (see main text).
Figure 5.
Figure 5.
Φ-factor analysis. A shows experimental Φ-factors for complexation (Φon) and decomplexation (Φoff). The cartoon above the histogram indicates the location of the investigated mutations. B and C illustrate the interpretation of Φ-factors on the basis of two hypothetical transition states for the complexation process. In B, the TS is late in the process just before the ligand fully fills the tunnel, whereas in C, it is early in the complexation process. If we mutate a residue located at the yellow star, which interacts with the ligand, the energy landscape changes differently in the two cases (dashed lines). Thus, in B the free energies of the bound state (ES) and the TS (ES) will shift in parallel because the mutated residue interacts with the ligand in both states, and this yields Φon = 1. Conversely, in C, only ES (and not ES) will be affected by the mutation, and Φon will be 0. This difference allowed us to assess whether a given mutation was located before or after the reaction coordinate of the TS. An analogous analysis may be conducted for decomplexation. In this case, the Φoff-factors that indicate whether the mutation is before or after the TS are 0 and −1, respectively.
Figure 6.
Figure 6.
Structural interpretation of the Φ-factor analysis. The transition state of complexation and decomplexation of Cel7A is proposed to occur at a stage in which the reducing end is near Trp-40, whereas the rest of the tunnel is empty. The unfavorable free energy of this structure arises from the (uncompensated) detachment of several glucose moieties from the cellulose surface. At a higher reaction coordinate of the complexation process (when the tunnel fills), compensating ligand interactions occur in the tunnel and hence lower the free energy. At a lower reaction coordinate, the free energy becomes more favorable as the ligand interacts with the cellulose surface.

References

    1. Jeoh T., Cardona M. J., Karuna N., Mudinoor A. R., and Nill J. (2017) Mechanistic kinetic models of enzymatic cellulose hydrolysis: a review. Biotechnol. Bioeng. 114, 1369–1385 10.1002/bit.26277 - DOI - PubMed
    1. Nill J., Karuna N., and Jeoh T. (2018) The impact of kinetic parameters on cellulose hydrolysis rates. Process Biochem. 74, 108–117 10.1016/j.procbio.2018.07.006 - DOI
    1. Badino S. F., Kari J., Christensen S. J., Borch K., and Westh P. (2017) Direct kinetic comparison of the two cellobiohydrolases Cel6A and Cel7A from Hypocrea jecorina. Biochim. Biophys. Acta Proteins Proteomics 1865, 1739–1745 10.1016/j.bbapap.2017.08.013 - DOI - PubMed
    1. Kurasin M., and Väljamäe P. (2011) Processivity of cellobiohydrolases is limited by the substrate. J. Biol. Chem. 286, 169–177 10.1074/jbc.M110.161059 - DOI - PMC - PubMed
    1. Payne C. M., Himmel M. E., Crowley M. F., and Beckham G. T. (2011) Decrystallization of oligosaccharides from the cellulose I β surface with molecular simulation. J. Phys. Chem. Lett. 2, 1546–1550 10.1021/jz2005122 - DOI

Publication types

Associated data

LinkOut - more resources