. 2020 Feb;19(2):390-404.
doi: 10.1074/mcp.TIR119.001641. Epub 2019 Dec 17.

Mass Spectrometry Based Immunopeptidomics Leads to Robust Predictions of Phosphorylated HLA Class I Ligands

Affiliations

Mass Spectrometry Based Immunopeptidomics Leads to Robust Predictions of Phosphorylated HLA Class I Ligands

Marthe Solleder et al. Mol Cell Proteomics. 2020 Feb.

Abstract

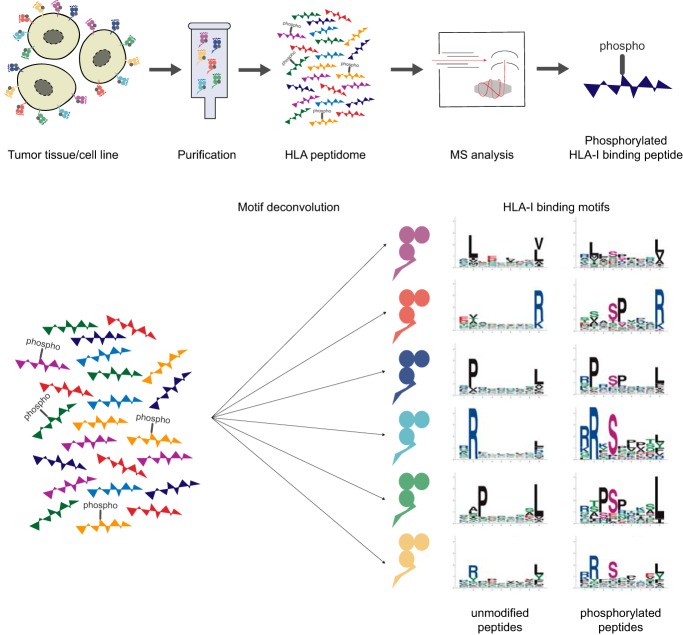
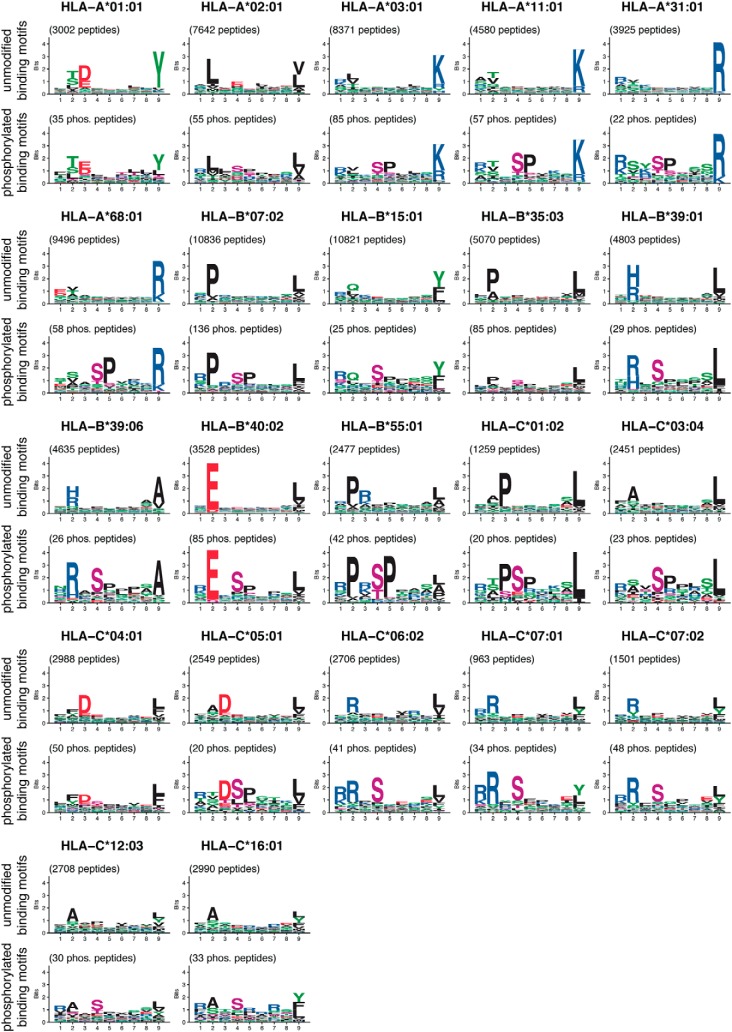
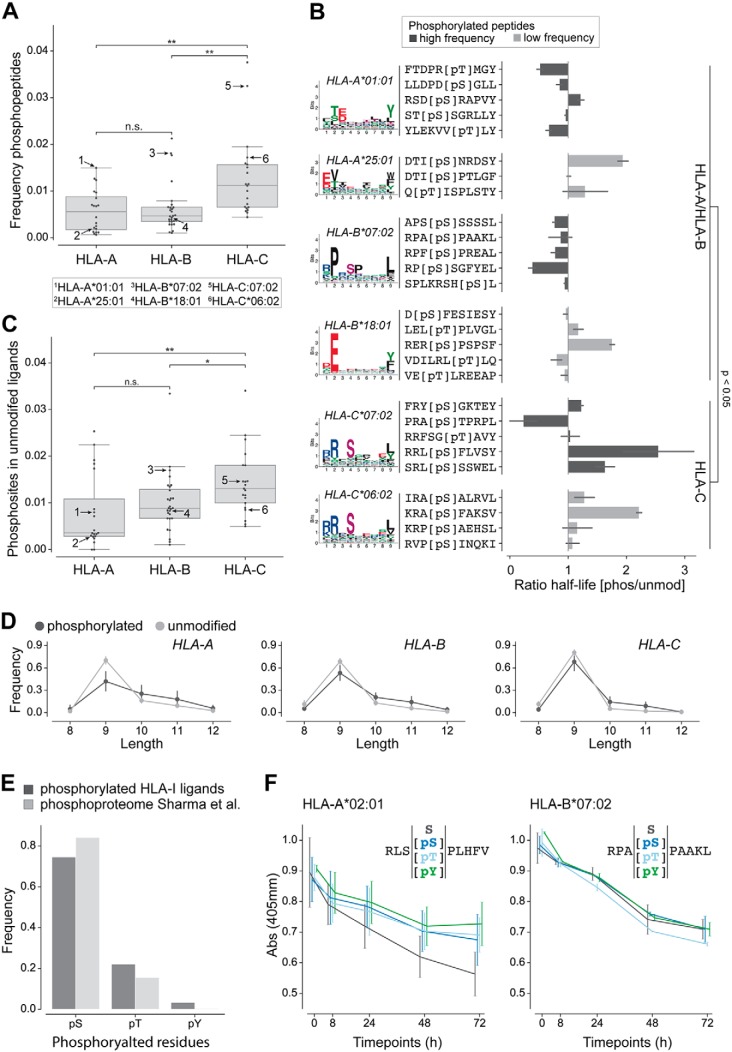
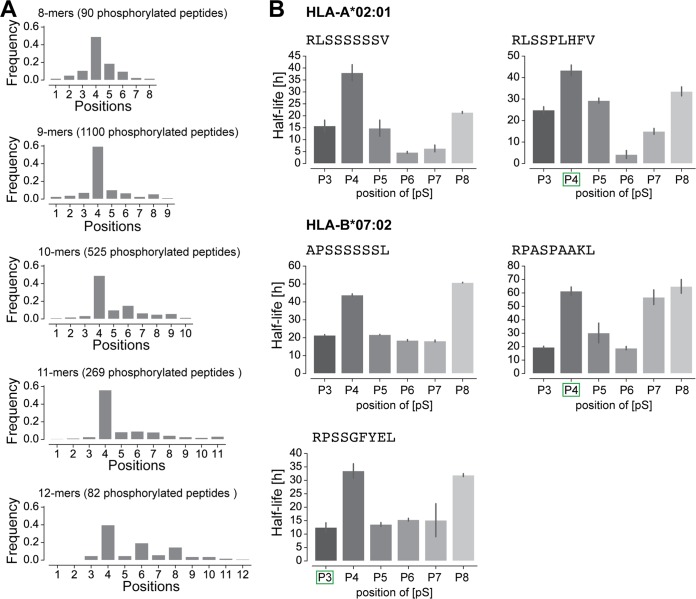
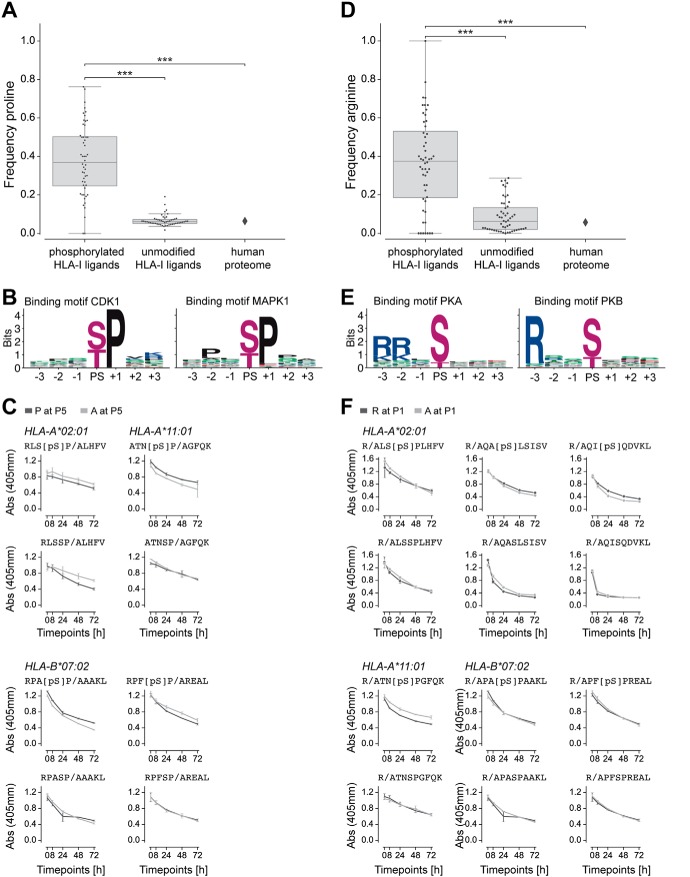
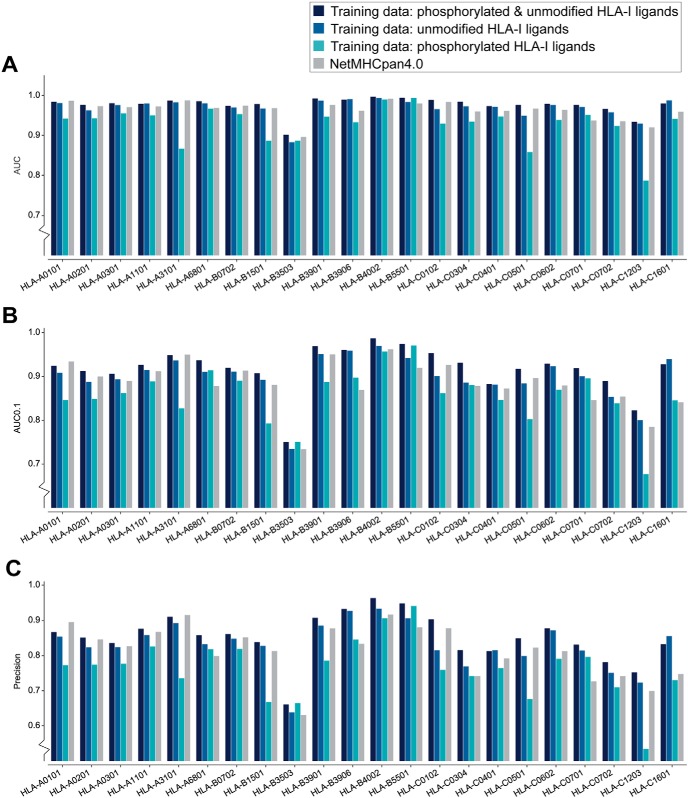
The presentation of peptides on class I human leukocyte antigen (HLA-I) molecules plays a central role in immune recognition of infected or malignant cells. In cancer, non-self HLA-I ligands can arise from many different alterations, including non-synonymous mutations, gene fusion, cancer-specific alternative mRNA splicing or aberrant post-translational modifications. Identifying HLA-I ligands remains a challenging task that requires either heavy experimental work for in vivo identification or optimized bioinformatics tools for accurate predictions. To date, no HLA-I ligand predictor includes post-translational modifications. To fill this gap, we curated phosphorylated HLA-I ligands from several immunopeptidomics studies (including six newly measured samples) covering 72 HLA-I alleles and retrieved a total of 2,066 unique phosphorylated peptides. We then expanded our motif deconvolution tool to identify precise binding motifs of phosphorylated HLA-I ligands. Our results reveal a clear enrichment of phosphorylated peptides among HLA-C ligands and demonstrate a prevalent role of both HLA-I motifs and kinase motifs on the presentation of phosphorylated peptides. These data further enabled us to develop and validate the first predictor of interactions between HLA-I molecules and phosphorylated peptides.

Keywords: HLA peptidomics; HLA-I ligand predictions; Mass spectrometry; computational biology; computational immunology; immunology; peptidomics; phosphorylated HLA-I binding motifs; phosphorylated HLA-I ligands; phosphorylation.


Conflict of interest statement

* The authors declare that they have no conflicts of interest with the contents of this article.

Figures

None
Graphical abstract
Fig. 1.
Fig. 1.
Overview of 9-mer HLA-I binding motifs of unmodified (top) and phosphorylated (bottom) ligands for HLA-I alleles with at least 20 phosphorylated ligands (9-mers) determined in this work. Phosphorylated residues are shown in purple.
Fig. 2.
Fig. 2.
Analysis of phosphorylated peptides across HLA-I alleles. A, Frequency of phosphorylated peptides per HLA-A, -B, and -C alleles for peptides of any length. Numbers in the plot indicate alleles tested in panel B. B, Ratio of half-lives between the phosphorylated (pS/pT) and the unmodified (S/T) peptides for several alleles. The colors of the bars correspond to alleles with high and low frequency of phosphorylated peptides in A. For HLA-A*01:01, HLA-B*07:02, HLA-C*06:02 and HLA-C*07:02 phosphorylated HLA-I binding motifs are shown, for HLA-A*25:01 and HLA-B*18:01 binding motifs of unmodified HLA-I ligands are given because too few phosphorylated peptides were observed in MS data for these alleles. C, Fraction of unmodified HLA-I 9-mer ligands containing a phosphosite at P4 for HLA-A, -B, and -C alleles. Arrows indicate the same alleles as in panel A. D, Length distribution of phosphorylated and unmodified ligands of HLA-A, HLA-B, and HLA-C alleles. E, Frequency of the different phosphorylated residues within phosphorylated HLA-I ligands of length 8 to 12 and within the human phosphoproteome (47). F, Dissociation assay (absorbance from ELISA) for unmodified and phosphorylated peptides (with phosphorylated serine, phosphorylated threonine, and phosphorylated tyrosine). (*, p ≤ 0.05; **, p ≤ 0.01.)
Fig. 3.
Fig. 3.
Phosphorylated positions in HLA-I ligands. A, Distribution of the position of phosphorylated residues in phosphorylated HLA-I ligands of lengths 8 to 12. B, Half-lives of HLA-I ligands for peptides with positions 3 to 8 substituted by phosphorylated serine. Green squares mark the position of the phosphosite (phosphorylated serine) for peptides found in MS data. Lack of green square indicates one unmodified peptide observed in MS data (APSSSSSSL) or one synthetic peptide (RLSSSSSSV) used in this in vitro assay.
Fig. 4.
Fig. 4.
Proline and arginine enrichment in phosphorylated HLA-I ligands. A, Frequency of proline next to phosphorylated residues in phosphorylated HLA-I ligands, proline at non-anchor positions in unmodified HLA-I ligands, and proline frequency in the human proteome. B, Kinase binding motifs for kinases CDK1 and MAPK1, three positions up- and downstream of the phosphosite (PS). C, Dissociation of peptides with proline or alanine next to phosphorylated serine (top) and next to unmodified serine in unmodified versions of the peptides (bottom). D, Frequency of arginine at P1 in phosphorylated HLA-I ligands, in unmodified HLA-I ligands, and in the human proteome. E, Kinase binding motifs for kinases PKA and PKB, three positions up- and downstream of the phosphosite (PS). F, Dissociation of peptides with arginine at P1 compared with peptides with alanine at P1 for both the phosphorylated (top) and unmodified (bottom) versions of the peptides. (***, p ≤ 0.001)
Fig. 5.
Fig. 5.
Cross validation of the predictor for each HLA-I allele with more than 20 phosphorylated 9-mer peptides. A, AUC values for phosphorylated HLA-I 9-mer peptides when trained on both phosphorylated and unmodified ligands (1st bar), trained only on unmodified ligands (2nd bar, treating phosphorylated residues as their unmodified counterpart), or when trained only on phosphorylated HLA-I ligands (3rd bar). For comparison, AUC values are also shown when using NetMHCpan4.0 and replacing phosphorylated residues by “X” in the input (4th bar). B, Results of the 5-fold cross validation measured by AUC0.1. C, Precision measured for the top 20% of the predicted peptides (equivalent to recall of the prediction data).

References

    1. Neefjes J., Jongsma M. L. M., Paul P., and Bakke O. (2011) Towards a systems understanding of MHC class I and MHC class II antigen presentation. Nat. Rev. Immunol. 11, 823–836 - PubMed
    1. Robinson J., Halliwell J. A., Hayhurst J. D., Flicek P., Parham P., and Marsh S. G. E. (2015) The IPD and IMGT/HLA database: Allele variant databases. Nucleic Acids Res. 43, D423–D431 - PMC - PubMed
    1. Gfeller D., and Bassani-sternberg M. (2018) Predicting antigen presentation — what could we learn from a million peptides? Front. Immunol. 9, 1–17 - PMC - PubMed
    1. Andreatta M., and Nielsen M. (2015) Gapped sequence alignment using artificial neural networks: Application to the MHC class I system. Bioinformatics 32, 511–517 - PMC - PubMed
    1. Jurtz V., Paul S., Andreatta M., Marcatili P., Peters B., and Nielsen M. (2017) NetMHCpan-4.0: improved peptide–MHC class I interaction predictions integrating eluted ligand and peptide binding affinity data. J. Immunol. 199, 3360–3368 - PMC - PubMed