. 2019 Dec 17;9(1):19290.
doi: 10.1038/s41598-019-55738-y.

Determining the Hierarchical Architecture of the Human Brain Using Subject-Level Clustering of Functional Networks

Affiliations

Determining the Hierarchical Architecture of the Human Brain Using Subject-Level Clustering of Functional Networks

Teddy J Akiki et al. Sci Rep. .

Abstract

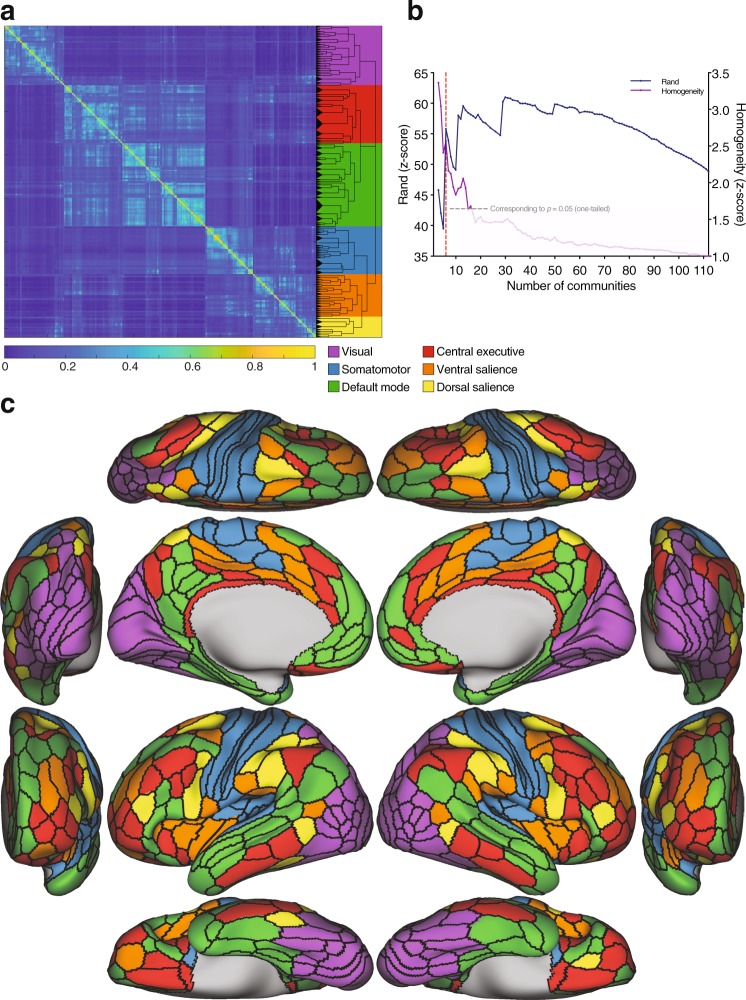
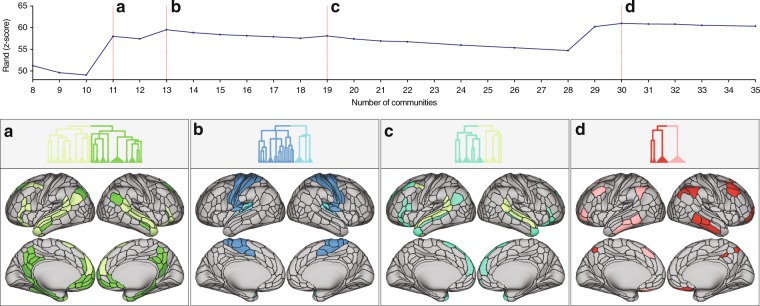
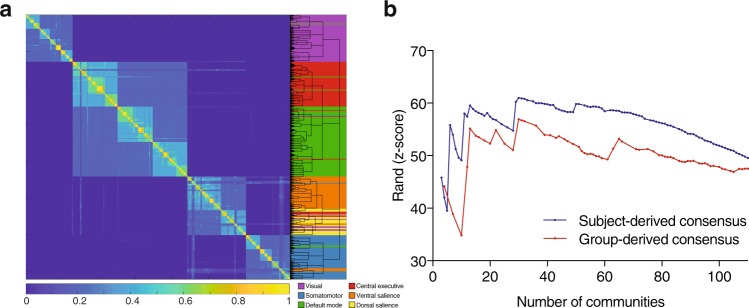
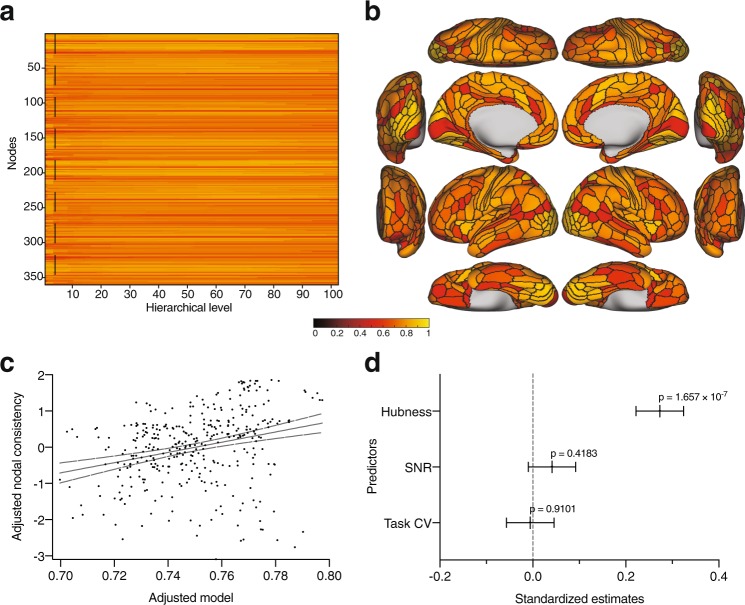
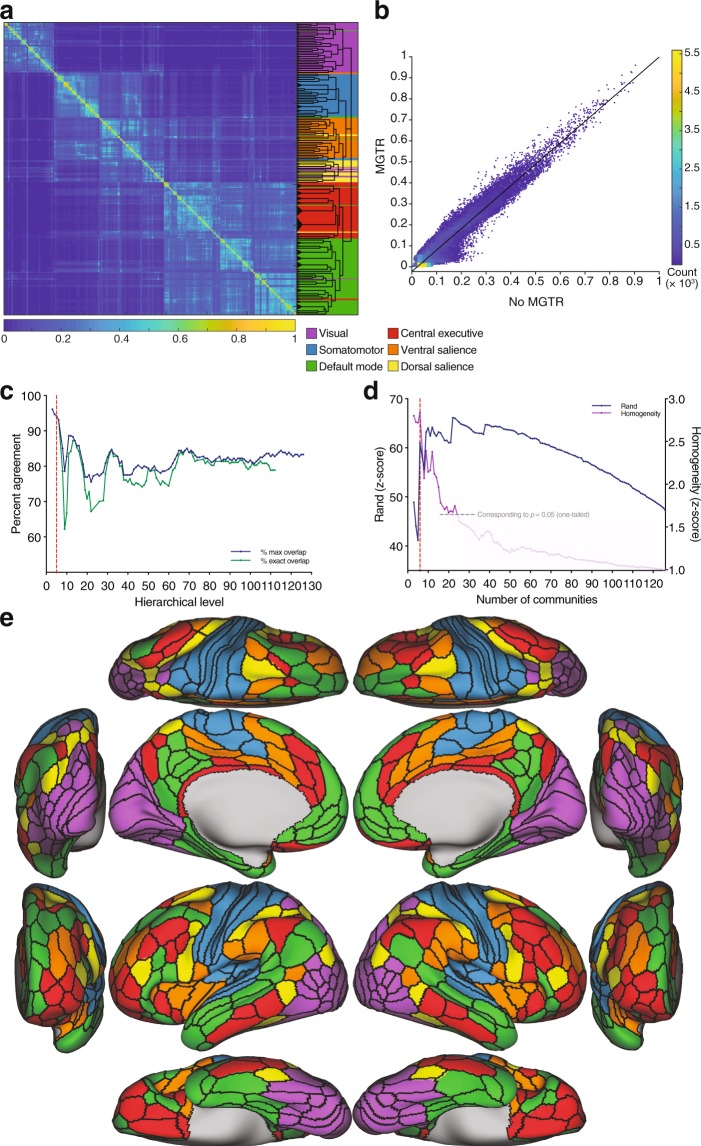
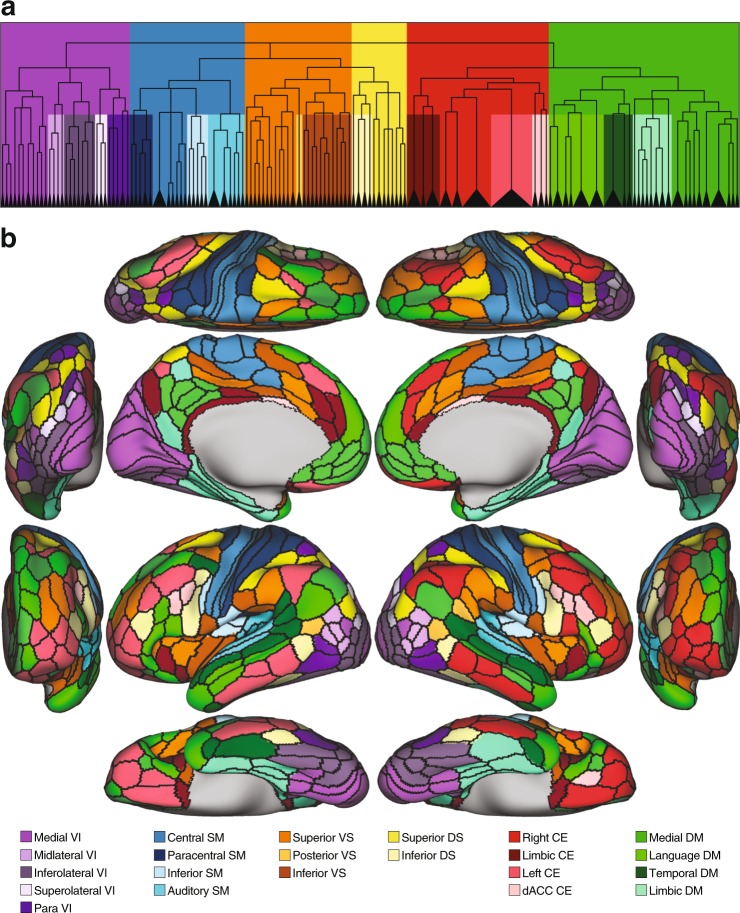
Optimal integration and segregation of neuronal connections are necessary for efficient large-scale network communication between distributed cortical regions while allowing for modular specialization. This dynamic in the cortex is enabled at the network mesoscale by the organization of nodes into communities. Previous in vivo efforts to map the mesoscale architecture in humans had several limitations. Here we characterize a consensus multiscale community organization of the functional cortical network. We derive this consensus from the clustering of subject-level networks. We applied this analysis to magnetic resonance imaging data from 1003 healthy individuals part of the Human Connectome Project. The hierarchical atlas and code will be made publicly available for future investigators.


Conflict of interest statement

C.G.A. has served as a consultant or on advisory boards for Genentech, Janssen, Lundbeck, and FSV7, serves as editor for the journal Chronic Stress published by SAGE Publications, Inc, and filed a patent for using mTOR inhibitors to augment the effects of antidepressants (filed on Aug 20, 2018).

Figures

Figure 1
Figure 1
Subject-derived consensus hierarchical partitioning. (a) Co-classification matrix summarizing the results of the subject-level clustering, sorted by community affiliation. The dendrogram represents the hierarchical organization of the nested communities. The length of the arms of the dendrogram are proportional to the average value of the local null model. The background colors represent the candidate division (see below). (b) Similarity plot showing the mean similarity between the partitioning in each hierarchical level in the dendrogram and the clustering at the subject-level quantified by the z-score of the Rand coefficient (blue), and the average z-scored functional homogeneity (purple; values of z > 1.645 represent values that are significantly more homogeneous than the null model at a one-sided α<0.05). The local maximum in similarity corresponds to the partitioning of the cortex into 6 communities (dashed red line). (c) Brain surface plots of the 6 communities corresponding to the local maximum: visual (purple); somatomotor (blue); default mode (green); central executive (red); ventral salience (orange); and dorsal salience (yellow).
Figure 2
Figure 2
Top: similarity plot showing the mean similarity between the partitioning in each hierarchical level and the clustering at the subject-level quantified by the z-score of the Rand coefficient. The local maxima in similarity are denoted by the dashed red lines. Bottom: emerging communities at local maxima, (a) The level of 11 communities is characterized by splitting of the default mode community into a mainly midline core community (dark green) and mainly middle temporal lobe community (light green), compared to the preceding level. (b) The level of 13 communities is characterized by the splitting of the auditory community (light blue) from the somatomotor community (dark blue). (c) The level of 19 communities is characterized by the emergence of the language community (turquoise) from lateral default mode (light green). (d) The level of 30 communities is characterized by the hemispheric split of the left and right central executive community (red and pink).
Figure 3
Figure 3
Group-derived consensus hierarchical partitioning. (a) Co-classification matrix summarizing the results of the group-level clustering, sorted by community affiliation. The dendrogram represents the hierarchical organization of the nested communities. The length of the arms of the dendrogram are proportional to the average value of the local null model. The background colors and key are superimposed from the subject-level consensus clustering that yielded 6 modules in Fig. 1a–c. (b) Similarity plot showing the mean similarity between the clustering at the subject-level, and the partitioning in each hierarchical level (number of communities) in the group-derived consensus partitioning (red) and the subject-derived consensus partitioning (blue); similarity is quantified using the z-score of the Rand coefficient.
Figure 4
Figure 4
Nodal consistency. (a) Nodal consistency scores across the hierarchies. Dashed line represents the hierarchy that resulted in 6 communities shown in Fig. 1c, and plotted in (b). (c) Multiple regression model that included nodal hubness, nodal SNR, and task coefficient of variation as predictors of nodal consistency. (d) Breakdown of the predictors and their standardized estimates.
Figure 5
Figure 5
Subject-derived consensus hierarchical partitioning after MGTR. (a) Co-classification matrix and dendrogram. Background colors represent the partitioning from Fig. 1. (b) Scatterplot showing the vectorized entries of the co-classification matrices with and without MGTR. (c) Percent consistency between the subject-derived consensus partitions with and without MGTR. (d) Similarity between the consensus partitioning and the clustering at the subject-level (blue), and the average z-scored functional homogeneity (purple; values of z > 1.645 represent values that are significantly more homogeneous than the null model at a one-sided α<0.05). Similar to Fig. 1, there is local maximum corresponding to the level of 6 communities. (e) Brain surface plots of the 6 communities after MGTR.
Figure 6
Figure 6
Subject-derived consensus hierarchical partitioning at the level yielding 22 communities. This figure corresponds to the Rand global maximum in Fig. 5d. (a) The dendrogram (from Fig. 5a) and background colors highlighting the fractionation of the 6 main communities into the 22 subcommunities. (b) Brain surface plots of the 22 communities.

References

    1. Yeo BTT, et al. The organization of the human cerebral cortex estimated by intrinsic functional connectivity. Journal of Neurophysiology. 2011;106:1125–1165. doi: 10.1152/jn.00338.2011. - DOI - PMC - PubMed
    1. Power JD, et al. Functional Network Organization of the Human Brain. Neuron. 2011;72:665–678. doi: 10.1016/j.neuron.2011.09.006. - DOI - PMC - PubMed
    1. Cole MW, Bassett DS, Power JD, Braver TS, Petersen SE. Intrinsic and Task-Evoked Network Architectures of the Human Brain. Neuron. 2014;83:238–251. doi: 10.1016/j.neuron.2014.05.014. - DOI - PMC - PubMed
    1. Alexander-Bloch A, et al. The discovery of population differences in network community structure: New methods and applications to brain functional networks in schizophrenia. NeuroImage. 2012;59:3889–3900. doi: 10.1016/j.neuroimage.2011.11.035. - DOI - PMC - PubMed
    1. Akiki, T. J., Averill, C. L. & Abdallah, C. G. A Network-Based Neurobiological Model of PTSD: Evidence From Structural and Functional Neuroimaging Studies. Current Psychiatry Reports19 (2017). - PMC - PubMed

Publication types