Review
. 2020 Mar;28(1):49-67.
doi: 10.1007/s10577-019-09624-y. Epub 2019 Dec 17.

Genomic methods for measuring DNA replication dynamics

Affiliations
Review

Genomic methods for measuring DNA replication dynamics

Michelle L Hulke et al. Chromosome Res. 2020 Mar.

Abstract

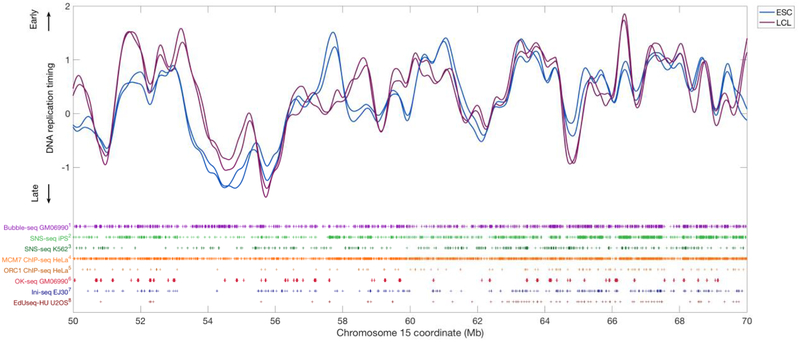
Genomic DNA replicates according to a defined temporal program in which early-replicating loci are associated with open chromatin, higher gene density, and increased gene expression levels, while late-replicating loci tend to be heterochromatic and show higher rates of genomic instability. The ability to measure DNA replication dynamics at genome scale has proven crucial for understanding the mechanisms and cellular consequences of DNA replication timing. Several methods, such as quantification of nucleotide analog incorporation and DNA copy number analyses, can accurately reconstruct the genomic replication timing profiles of various species and cell types. More recent developments have expanded the DNA replication genomic toolkit to assays that directly measure the activity of replication origins, while single-cell replication timing assays are beginning to reveal a new level of replication timing regulation. The combination of these methods, applied on a genomic scale and in multiple biological systems, promises to resolve many open questions and lead to a holistic understanding of how eukaryotic cells replicate their genomes accurately and efficiently.

Keywords: DNA replication; genomics; replication origin; replication timing; single cell.


Figures

Figure 1.
Figure 1.. DNA replication timing.
DNA initiates at replication origins, each of which is activated at a characteristic time during S phase. Replication continues bi-directionally until all replication forks converge and the entire genome is replicated. The DNA replication timing program can be represented in the form of a replication profile (bottom), in which the amplitude of the profile represents the replication timing along the chromosome and peaks correspond to the locations of replication origins. These replication profiles also correspond to the average DNA copy number in a population of replicating cells, in which earlier-replicating regions will have a greater DNA content compared to later-replicating genomic regions.
Figure 2.
Figure 2.. Methods for measuring DNA replication timing.
(A–D) Different cell isolation schemes for measuring DNA replication timing. In Repli-seq (A–B), cells are incubated with BrdU, 2–6 fractions of S phase cells are sorted (five fractions are shown in B), and BrdU-containing DNA is sequenced. The choice of gate locations varies from one experiment to another, with some experiments using wider gates that together span most of S phase. Alternatively, the entire S phase fraction as well as G1 cells can be sorted and DNA sequenced without BrdU incorporation (C); DNA copy number is analyzed directly to infer replication dynamics. The control G1 cells are sorted from the left side of the G1 peak, in order to avoid inclusion of contaminating S phase cells (which would distort the replication pattern in early S phase). G2 cells could also be used as controls instead of G1 cells. (D) Last, DNA can be sequenced from proliferating cells without any sorting. This reduces technical influences and avoids arbitrary choices of gate locations. (E) Representative DNA replication timing profiles for the lymphoblastoid cell line GM12878 generated by either two-fraction Repli-seq (Pope et al., 2014) or DNA copy number without sorting (Koren et al., 2014). Replication profiles from multi-fraction Repli-seq and from S/G1 sorted-cells (not shown) typically fall in between the other two approaches. Greater dynamic range and sharper peaks may be obtained by avoiding FACS-sorting of S phase cells.
Figure 3.
Figure 3.. DNA replication origin mapping.
Various techniques have been used to map the locations of DNA replication origins in the human genome. Shown are the mapped origin locations in several of these techniques, together with replication timing profiles in human lymphoblastoid cell lines (LCL) and embryonic stem cells (ESCs; two cell lines each) measured by DNA copy number sequencing. Replication origin or initiation zone locations are based on the mapping used by each respective study, and are represented as plus signs with widths that correspond to the size of the initiation sites or zones. At some locations, replication origins are consistent between techniques and also correspond to peaks in the replication timing profiles. However, there are also fundamental differences among origin mapping methods in the number of initiation sites along chromosomes, their widths (precise sites vs broader initiation zones), and the actual locations of predicted origins. 1 (Mesner et al., 2013); 2 (Smith et al., 2016); 3 (Picard et al., 2014); 4 (Sugimoto et al., 2018); 5 (Dellino et al., 2013); 6 (Petryk et al., 2016); 7 (Langley et al., 2016); 8 (Macheret and Halazonetis, 2018). GM06990 is an LCL.

References

    1. Agier N, Delmas S, Zhang Q, Fleiss A, Jaszczyszyn Y, van Dijk E, Thermes C, Weigt M, Cosentino-Lagomarsino M, and Fischer G (2018). The evolution of the temporal program of genome replication. Nat Commun 9, 2199. - PMC - PubMed
    1. Aladjem MI, and Redon CE (2017). Order from clutter: selective interactions at mammalian replication origins. Nat Rev Genet 18, 101–116. - PMC - PubMed
    1. Almeida R, Fernandez-Justel JM, Santa-Maria C, Cadoret JC, Cano-Aroca L, Lombrana R, Herranz G, Agresti A, and Gomez M (2018). Chromatin conformation regulates the coordination between DNA replication and transcription. Nat Commun 9, 1590. - PMC - PubMed
    1. Arneson N, Hughes S, Houlston R, and Done S (2008). Whole-Genome Amplification by Degenerate Oligonucleotide Primed PCR (DOP-PCR). CSH Protoc 2008, pdb prot4919. - PubMed
    1. Artemov AV, Andrianova, Bazykin, and Seplyarskiy (2019). POLD replicates both strands of small kilobase-long replication bubbles initiated at a majority of human replication origins. BioRxiv 10.1101/174730. - DOI

Publication types

LinkOut - more resources