Comparative Study
. 2019 Dec 18;20(1):285.
doi: 10.1186/s13059-019-1892-z.

Whole genome DNA sequencing provides an atlas of somatic mutagenesis in healthy human cells and identifies a tumor-prone cell type

Affiliations
Comparative Study

Whole genome DNA sequencing provides an atlas of somatic mutagenesis in healthy human cells and identifies a tumor-prone cell type

Irene Franco et al. Genome Biol. .

Abstract

Background: The lifelong accumulation of somatic mutations underlies age-related phenotypes and cancer. Mutagenic forces are thought to shape the genome of aging cells in a tissue-specific way. Whole genome analyses of somatic mutation patterns, based on both types and genomic distribution of variants, can shed light on specific processes active in different human tissues and their effect on the transition to cancer.

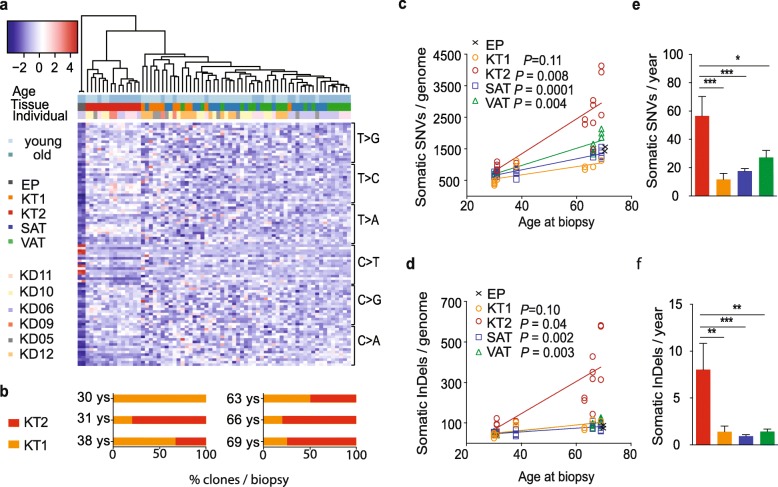
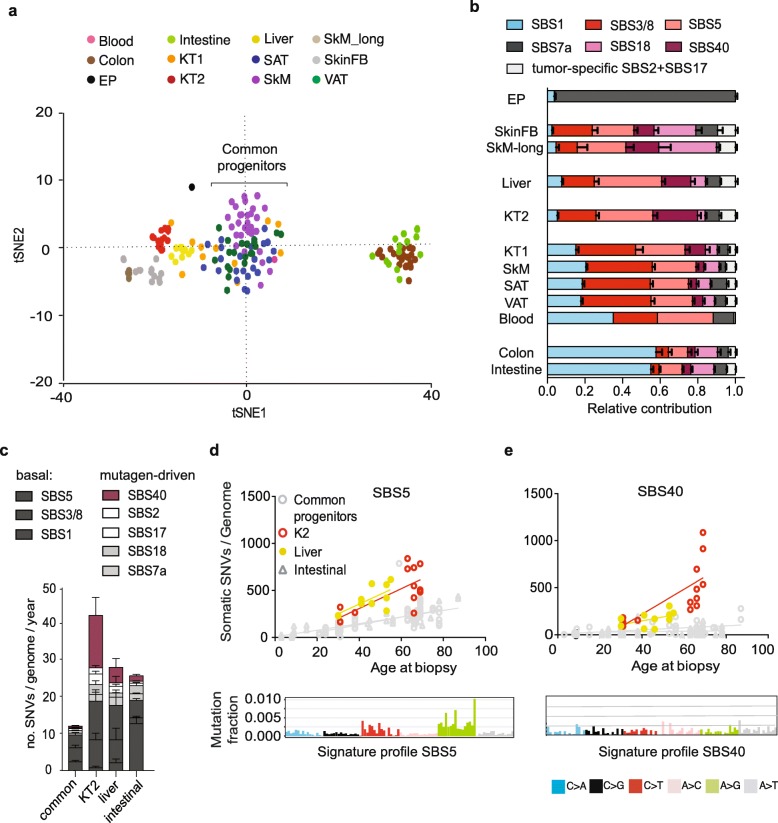
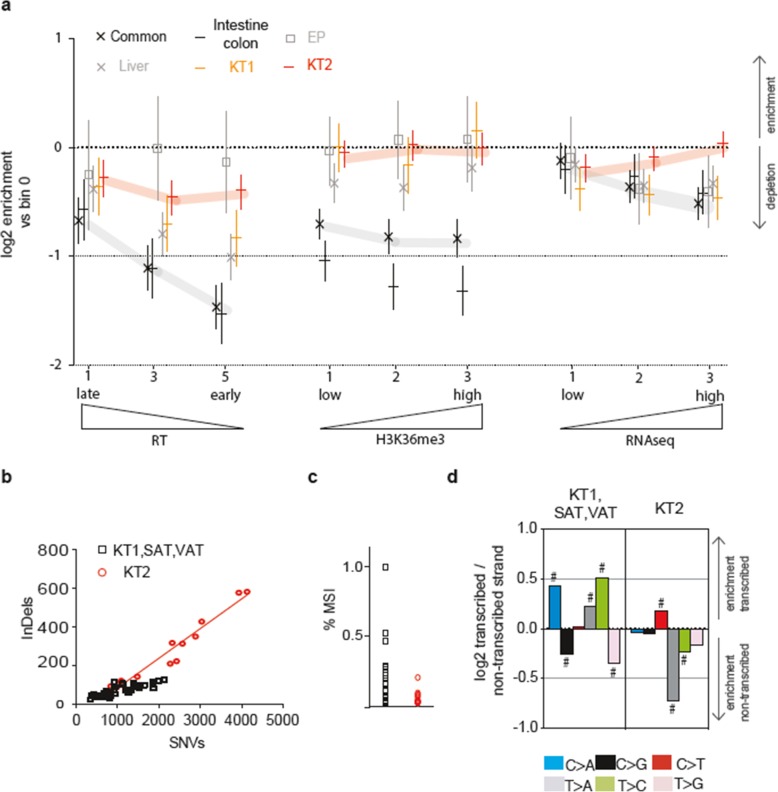
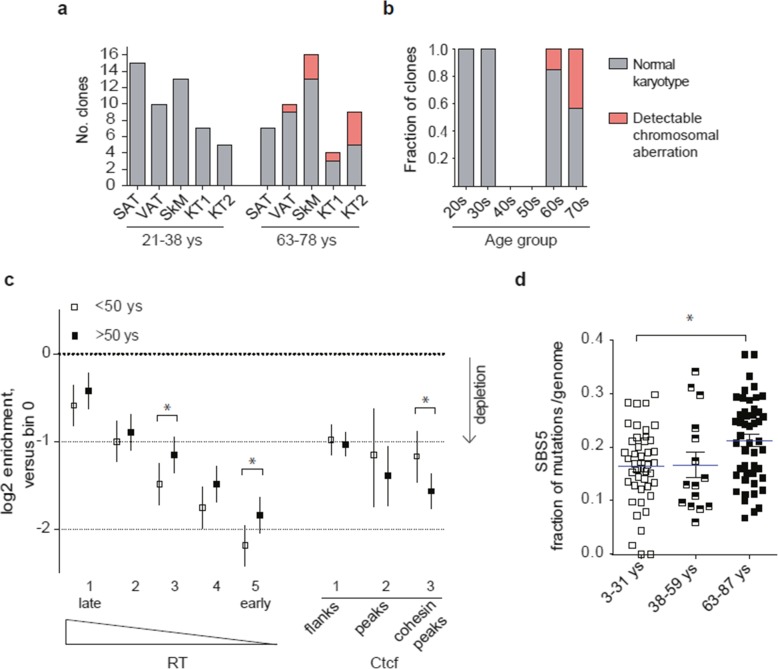
Results: To analyze somatic mutation patterns, we compile a comprehensive genetic atlas of somatic mutations in healthy human cells. High-confidence variants are obtained from newly generated and publicly available whole genome DNA sequencing data from single non-cancer cells, clonally expanded in vitro. To enable a well-controlled comparison of different cell types, we obtain single genome data (92% mean coverage) from multi-organ biopsies from the same donors. These data show multiple cell types that are protected from mutagens and display a stereotyped mutation profile, despite their origin from different tissues. Conversely, the same tissue harbors cells with distinct mutation profiles associated to different differentiation states. Analyses of mutation rate in the coding and non-coding portions of the genome identify a cell type bearing a unique mutation pattern characterized by mutation enrichment in active chromatin, regulatory, and transcribed regions.

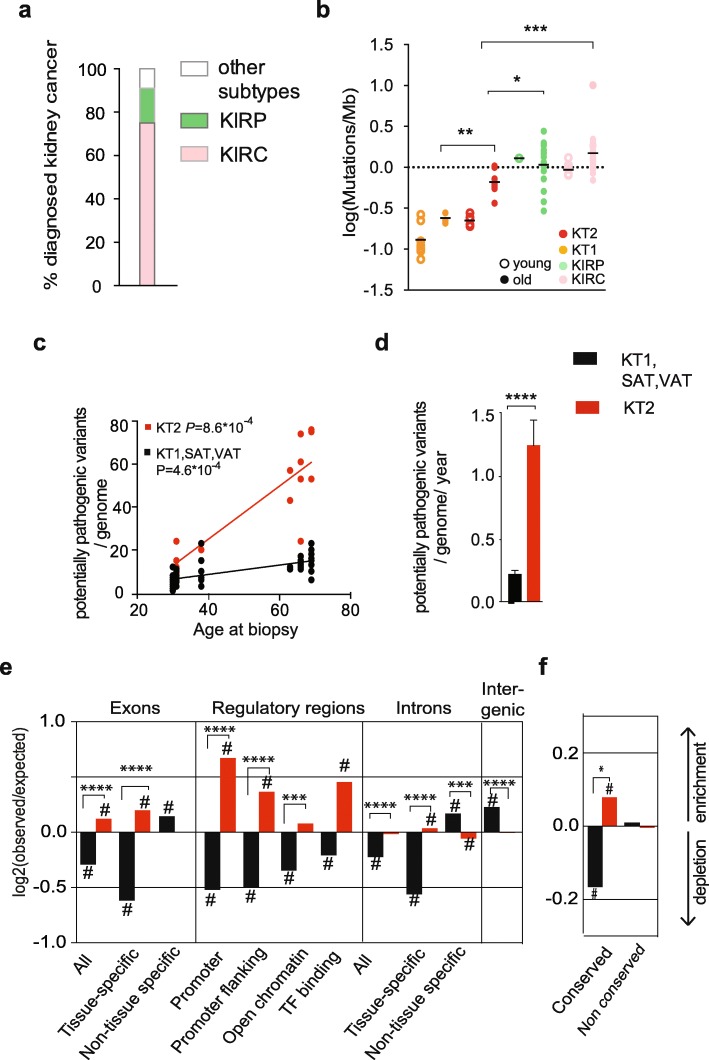
Conclusions: Our analysis of normal cells from healthy donors identifies a somatic mutation landscape that enhances the risk of tumor transformation in a specific cell population from the kidney proximal tubule. This unique pattern is characterized by high rate of mutation accumulation during adult life and specific targeting of expressed genes and regulatory regions.

Keywords: Aging; Kidney cancer; Proximal tubule; Somatic mutations; kidney progenitors.


Conflict of interest statement

The authors declare that they have no competing interests.

Figures

Fig. 1
Fig. 1
Somatic mutation detection in single genomes from different tissues of the same individual. a Experimental strategy for single genome analysis of progenitor cells from multiple tissues from the same healthy individual. Blood, kidney, subcutaneous fat (SAT), visceral fat (VAT), and skin biopsies were obtained from living kidney donors undergoing surgery. The blood tissue was whole genome sequenced (WGS) as a bulk to obtain the individual’s reference sequence. The kidney tubule (KT) and epidermis (EP) portions were separated from the kidney and skin biopsies, respectively. Single progenitor cells were isolated from KT, SAT, VAT, and EP and clonally expanded in culture to obtain WGS data. These data were filtered using the individual’s reference sequence to obtain the catalogue of somatic variants for every clone. b Schematic summary of sequenced samples and analysis strategy. Two to five single genomes per biopsy were sequenced (white numbers in the round plot) from six individuals of either younger (30–38) or older (63–69) age. KT progenitors were sequenced for all six individuals, while SAT, VAT, and EP progenitors were sequenced in a subset of the donors. Somatic mutation data were used to study either the tissue or the age effect on mutation accumulation. An example of tissue-related differences found in the study is provided (top right): somatic SNVs found in 4 clones from different tissues of the same individual were plotted according to their genomic position and in different colors according to the type of base substitution. An example of age-related changes is provided (bottom right): total amount of SNVs in the genome of each sequenced clone from two selected individuals of either younger (30 years) or older (69 years) age
Fig. 2
Fig. 2
Clustering of samples on the base of mutation types defines similarities between different tissues and two subsets of KT cells. a Mutation pattern of 69 single genomes obtained from different human tissues of six healthy individuals of either younger (30–38) or older (63–69) age (horizontal). SNVs were subdivided in 96 classes based on the single base substitution types and their trinucleotide context (vertical) and the relative amount of mutations for each class were plotted as a heatmap. Hierarchical clustering of the samples based on the mutation pattern is shown on top of the heatmap. b Percentage of kidney-tubule-derived cells clustering in the KT1 or KT2 subset per biopsy. Each biopsy is defined by the age of the donor (30 years N = 4; 31 years N = 5; 38 years N = 3; 63 years N = 4; 66 years N = 5; 69 years N = 4 clones). c, d Number of somatic single nucleotide variants (SNVs, c) and small insertions/deletions (InDels, d) found in single genomes of multiple progenitors from 6 individuals of different ages. (x axis) The numbers of somatic variants per clone were normalized to the percentage of autosomes covered by the sequencing. Linear regression curves and P values calculated with the linear mixed models are shown for each tissue. e, f Average yearly increase of somatic SNVs (e) and InDels (f) per tissue. * P < 0.05, **P < 0.01, ***P < 0.001, one-way ANOVA and multiple comparisons tests. EP epidermis, KT1 kidney tubule 1, KT2 kidney tubule 2, SAT subcutaneous fat, VAT visceral fat
Fig. 3
Fig. 3
Meta-analysis of somatic mutation data from healthy donors defines basal and mutagen-driven mutagenesis in adult tissues. Sixty-nine single genomes from epidermis (EP), kidney tubule 1 (KT1), kidney tubule 2 (KT2), subcutaneous fat (SAT), and visceral fat (VAT) were analyzed together with public datasets of somatic mutations from WGS of clonally expanded non-cancer cells, including skin fibroblasts (SkinFB) [15]; liver, intestine, and colon stem cells [12]; skeletal muscle progenitors (SkM) [11]; and blood progenitors [13]. a tSNE plot of the trinucleotide profile of somatic SNVs. Multiple tissues displaying a common mutation profile (SkM, SAT, VAT, KT1, and blood) were named “common progenitors.” b Relative contribution of the eight mutational signatures identified in healthy cells via non-negative matrix factorization. Each signature was named after the most similar single base substitution (SBS) signature from [18]. c Average yearly increase of somatic SNVs obtained by linear fit of mutations with age in the common progenitors, KT2, liver stem cells, and intestinal stem cell (intestine and colon) groups. P values from linear mixed models are shown in Additional file 1: Table S3a. d. e Linear increase of mutations with age and signature profile of SBS5 (d) and SBS40 (e) in KT2 (red), liver (yellow), and common progenitors and intestine-derived (colon and intestine stem cells) samples (gray). SBS5 and SBS40 showed similar profiles (bottom), but different tissue distribution
Fig. 4
Fig. 4
KT2 cells are proximal tubule cells exposed to mutagens. a Cartoon representing a kidney nephron and the location of the different tumor samples included in the analyses (according to [27, 36]). A section of proximal tubule (PT) is enlarged to show the trafficking of water, solutes, and other compounds across the PT epithelium. b tSNE plot of the trinucleotide profile of somatic SNVs in healthy (n = 161) and tumor (n = 192) samples. The common progenitors (SAT, VAT, SkM, and blood) and kidney-derived healthy and tumor genomes are highlighted with specific colors, while all other samples are shown in gray. c FACS analysis of the kidney progenitor markers CD133 and CD24 in selected KT1 and KT2 clones (n = 4). The average percentage of double- or single (CD24)-positive cells per clone is shown. d Heatmap showing the relative expression of markers of undifferentiated and differentiated kidney cells in single clones (subdivided in 11 categories described in the legend on the right) from either the KT1 (n = 4) or the KT2 (n = 2) group, tested by qPCR. Human embryonic stem cells (ESC bulk) and skin fibroblasts (SkFB bulk) were included as negative controls, together with a VAT clone. RNA extracted from a fresh kidney biopsy was included as positive control. The same KT1 clone is marked with an arrow in b and d, to highlight its intermediate KT1/KT2 phenotype at both somatic mutation (b) and gene expression (d) levels. KT1 and KT2, healthy kidney-tubule-derived cells; KIRC, clear cell renal cell carcinoma; KIRP, papillary renal cell carcinoma; KICH, chromophobe renal cell carcinoma; PT, proximal tubule; DT, distal tubule; S1, first segment of PT, convoluted; S3, last segment of PT, straight
Fig. 5
Fig. 5
Kidney PT shows a unique somatic mutation pattern that confers high risk for tumor transformation. a Epidemiologic data showing the percentage of kidney tumors either derived from the proximal tubule, such as KIRC (clear cell renal cell carcinoma) and KIRP (papillary cell renal cell carcinoma), or from other kidney structures (other subtypes). b Somatic mutation burden in KT1, KT2, KIRP, and KIRC of either a younger (30–40) or older (60–70) age range. Significance among older groups was measured by one-way ANOVA. c, d Linear fit with age (c) and yearly increase (d) of potentially pathogenic variants in KT2 vs KT1-SAT-VAT clones. Potentially pathogenic variants are defined as follows: all variants were annotated with CADD (Combined Annotation Dependent Depletion; https://cadd.gs.washington.edu/). SNVs and InDels predicted to affect the coding sequence (presenting CADD score > 15) were selected and subsequently filtered on expression data in order to select only variants affecting a gene actually expressed in the tissue of origin of the clone. Tissue-specific and non-tissue-specific genes correspond to the expressed and non-expressed genes in the corresponding tissue according to the Human Protein Atlas (http://proteinatlas.com). Adjusted P values of the linear fit are calculated with the linear mixed model (c) or two-sided t test (d). e Enrichment (upward bars) or depletion (downward bars) of somatic mutations in indicated genomic features. The log2 ratio of the number of observed and expected point mutations indicates the effect size of the enrichment or depletion in each region. Log2 = 0 corresponds to a number of observed mutations equal to the number expected by random distribution. f Enrichment (upward bars) or depletion (downward bars) of somatic mutations in conserved and non-conserved regions of the genome. #P < 0.05, one-sided binomial test. ***P < 0.001, ****P < 0.0001 two-sided t test of log2 ratios for either KT2 or KT1-SAT-VAT in specified genomic regions. EP epidermis, KT1 kidney tubule 1, KT2 kidney tubule 2, SAT subcutaneous fat, VAT visceral fat
Fig. 6
Fig. 6
Mutation enrichment in specific genomic regions provides information on DNA repair efficiency and mutagen exposure in different cell types. a Enrichment/depletion of mutations in specific genomic regions. The genomes were divided in multiple sectors (bins) according to decreasing DNA replication time (RT, bins 0 to 5. For clarity, only bins 1, 3, and 5 are shown), increasing abundance of the histone mark H3K36me3 (bins 0–3), and increasing transcriptional levels (RNA-seq, bins 0–3). The relative abundance of mutations in each bin vs bin 0 for every tissue (EP, liver, KT1, KT2) or tissue group (common progenitors: SAT, VAT, SkM, blood; intestine-colon) is estimated as the coefficient in negative binomial regression (expressed as log2), where error bars show its 95% C.I. b Linear regression of SNVs and InDels per genome in the KT2 vs KT1-SAT-VAT group. c Percentage of sites subjected to microsatellite instability (MSI) in each genome of either the KT2 or the KT1-SAT-VAT group. d Enrichment of the six classes of substitution types in either transcribed or non-transcribed strand of genes. The log2 ratio of the number of observed and expected point mutations indicates the effect size of the enrichment in the transcribed (upper) or non-transcribed (lower) strand. #P < 0.05, one-sided binomial test
Fig. 7
Fig. 7
Genomic instability and weakening of DNA repair with aging. a Number of clones showing large chromosomal aberrations per tissue and age group. Young 21–38, old 63–78. b Fraction of genomes showing large chromosomal aberrations in the samples analyzed in a, but divided in tighter age groups (10 year-span). c Enrichment/depletion of mutations according to DNA replication timing (RT) while controlling for CTCF binding sites in either younger (< 50 years old, N = 52) or older (> 50 years, N = 54) genomes from the tissues not showing signs of exposure to external mutagens (SkM, SAT, VAT, intestine, and colon, according to the analyses in Figs. 3 and 6). Enrichments are coefficients from negative binomial regression (as log2), and error bars are their 95% C.I. Significance of young-vs-old differences was tested via a Z-test on the interaction term between age and replication time bin d. Fraction of SBS5 mutations per genome in different age groups of SkM, SAT, VAT, blood, intestine, and colon cells. *P < 0.05, one-way ANOVA and multiple comparison tests

References

    1. Vijg J, Suh Y. Genome instability and aging. Annu Rev Physiol. 2013;75:645–668. doi: 10.1146/annurev-physiol-030212-183715. - DOI - PubMed
    1. Zhang Lei, Vijg Jan. Somatic Mutagenesis in Mammals and Its Implications for Human Disease and Aging. Annual Review of Genetics. 2018;52(1):397–419. doi: 10.1146/annurev-genet-120417-031501. - DOI - PMC - PubMed
    1. Chanock SJ. The paradox of mutations and cancer. Science. 2018;362:893–894. doi: 10.1126/science.aav5697. - DOI - PubMed
    1. Welch JS, Ley TJ, Link DC, Miller CA, Larson DE, Koboldt DC, Wartman LD, Lamprecht TL, Liu F, Xia J, et al. The origin and evolution of mutations in acute myeloid leukemia. Cell. 2012;150:264–278. doi: 10.1016/j.cell.2012.06.023. - DOI - PMC - PubMed
    1. Dong X, Zhang L, Milholland B, Lee M, Maslov AY, Wang T, Vijg J. Accurate identification of single-nucleotide variants in whole-genome-amplified single cells. Nat Methods. 2017;14:491–493. doi: 10.1038/nmeth.4227. - DOI - PMC - PubMed

Publication types