Review
. 2019 Nov 29:10:1416.
doi: 10.3389/fphys.2019.01416. eCollection 2019.

QuantiMus: A Machine Learning-Based Approach for High Precision Analysis of Skeletal Muscle Morphology

Affiliations
Review

QuantiMus: A Machine Learning-Based Approach for High Precision Analysis of Skeletal Muscle Morphology

Jenna M Kastenschmidt et al. Front Physiol. .

Abstract

Skeletal muscle injury provokes a regenerative response, characterized by the de novo generation of myofibers that are distinguished by central nucleation and re-expression of developmentally restricted genes. In addition to these characteristics, myofiber cross-sectional area (CSA) is widely used to evaluate muscle hypertrophic and regenerative responses. Here, we introduce QuantiMus, a free software program that uses machine learning algorithms to quantify muscle morphology and molecular features with high precision and quick processing-time. The ability of QuantiMus to define and measure myofibers was compared to manual measurement or other automated software programs. QuantiMus rapidly and accurately defined total myofibers and measured CSA with comparable performance but quantified the CSA of centrally-nucleated fibers (CNFs) with greater precision compared to other software. It additionally quantified the fluorescence intensity of individual myofibers of human and mouse muscle, which was used to assess the distribution of myofiber type, based on the myosin heavy chain isoform that was expressed. Furthermore, analysis of entire quadriceps cross-sections of healthy and mdx mice showed that dystrophic muscle had an increased frequency of Evans blue dye+ injured myofibers. QuantiMus also revealed that the proportion of centrally nucleated, regenerating myofibers that express embryonic myosin heavy chain (eMyHC) or neural cell adhesion molecule (NCAM) were increased in dystrophic mice. Our findings reveal that QuantiMus has several advantages over existing software. The unique self-learning capacity of the machine learning algorithms provides superior accuracy and the ability to rapidly interrogate the complete muscle section. These qualities increase rigor and reproducibility by avoiding methods that rely on the sampling of representative areas of a section. This is of particular importance for the analysis of dystrophic muscle given the "patchy" distribution of muscle pathology. QuantiMus is an open source tool, allowing customization to meet investigator-specific needs and provides novel analytical approaches for quantifying muscle morphology.

Keywords: Duchenne muscular dystrophy; central nucleation; cross-sectional area; histological analysis; machine learning; mdx; muscle regeneration; myofiber typing.


Figures

Figure 1
Figure 1
QuantiMus application workflow. The QuantiMus analysis pipeline is composed of five steps: (1) the “Fill Myofiber Gaps” function; (2) “Myofiber Detection” function; (3) “Centrally-Nucleated Fibers” function; (4) “Measure Fluorescence” function; and (5) “Save and Export Data” function.
Figure 2
Figure 2
The “Fill Myofiber Gaps” function corrects gaps in myofiber boundaries that hinder single myofiber discrimination. (A) Screenshot of the QuantiMus user interface used for the “Fill Myofiber Gaps” function. (B) Representative image of a cross-section of 4-week-old mdx quadriceps, stained with anti-laminin antibody (white). (C) Zoomed in region of the cross-section in (B) (yellow box). (D) Interactive display showing thresholds set by the user with sliders in the Fill Myofiber Gaps Tab. (E) Myofiber gaps detected and filled by the algorithm (white regions highlighted by yellow arrows). (F) Binary image generated from the cross-section in (C) that was not corrected with the “Fill Myofiber Gaps” function; colored regions indicate grouped ROIs incorrectly detected as one myofiber. (G) Binary image generated from the cross-section in (C) that was corrected using the “Fill Myofiber Gaps” function. Scale bar = 200 μm.
Figure 3
Figure 3
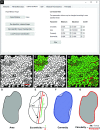
Classification of skeletal muscle myofibers. (A) Image of the QuantiMus user interface used to classify myofibers. (B) Binary image of quadriceps from 4-week-old mdx mice generated during the “Fill Myofiber Gaps” function. (C) Binary image highlighting user-classified ROIs (an ROI is defined as any contiguous region of pixels) used to train the machine learning algorithm for subsequent automated ROI classification. Green ROIs = Myofibers, red ROIs = interstitial space and artifacts. (D–G) Properties used to classify regions as myofibers. (D) Area (gray) is the total number of pixels in the region. (E) Eccentricity is calculated by dividing the focal distance (f, green line) by the major axis length (m, red line). Focal distance is defined as the length between the foci and the major axis length is the longest diameter of a region. (F) Convexity of an ROI is calculated by dividing the area (hatched area) by the convex area (blue area). The convex area is defined as the area within the smallest convex polygon that can be drawn around a region. (G) Circularity is determined using Eq. 3 as shown. Area = gray region, perimeter = red boundary. (H) A representative final image rendered by automated classification subsequently used for myofiber quantification and downstream analysis. Scale bar = 200 μm.
Figure 4
Figure 4
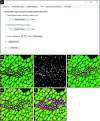
Detection of CNFs. (A) The QuantiMus user interface that is utilized for the detection of CNFs. (B) Representative cross-section of 4-week-old mdx mouse quadriceps previously classified using the “Myofiber Detection” function. (C) The corresponding DAPI image of the cross-section in (B). (D) The overlay of classified and DAPI images. (E) Eroded myofibers (yellow) generated during the “Centrally-Nucleated Fibers” function. (F) The “Centrally-Nucleated Fibers” function end-product provides an image with CNFs labeled purple. Scale bar = 200 μm.
Figure 5
Figure 5
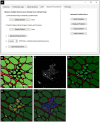
Measurement of fluorescence intensity in single myofibers. (A) QuantiMus user interface that is utilized for measuring the myofiber mean fluorescence intensity (MFI) of an overlaid fluorescence image. (B) Classified image generated by the “Myofiber Detection” function. (C) Fluorescence image of anti-eMyHC antibody-stained quadriceps. (D) Image in (C) is overlaid onto the corresponding classified image in (B). (E) User-defined eMyHC+ myofibers (yellow) are used as a threshold for the automated determination of remaining eMyHC+ myofibers. (F) eMyHC+ myofibers are relabeled blue following the “Determine Positive Fibers” step. Scale bar = 100 μm.
Figure 6
Figure 6
Data export. QuantiMus user interface utilized for the export of saved data.
Figure 7
Figure 7
QuantiMus accurately measures myofiber CSA and minimum Feret diameter. (A) The number of myofibers detected using FIJI, QuantiMus (QM), MyoVision (MV), and SMASH in 4-week-old WT and mdx quadriceps. (B) The percent accuracy of the number of myofibers detected by each method. (C) The average (Avg) CSA (μm2) of myofibers in (A). (D) The percent accuracy of average myofiber CSA for each method. Greater than 2,000 fibers from five representative fields, taken from two mice were used for each group. (E) The number of myofibers detected in human muscle. (F) The percent accuracy of myofiber classification for each method in (E). (G) The Avg CSA (μm2) detected by each method in (E). (H) The percent accuracy of average myofiber CSA for each method in (G). Over 2,400 myofibers from six representative fields, taken from two patients were measured. Connected data points are indicative of a single image analyzed by each method. *p < 0.05, **p < 0.01, ***p < 0.001, and ****p < 0.0001 using a two-way repeated measures ANOVA with a multiple comparison test (main column effect). Statistics are compared to FIJI (A,C,E,G) or QM (B,D,F,H).
Figure 8
Figure 8
Defining CNFs. (A) The number of CNFs detected using manual measurement (FIJI), QuantiMus (QM), and SMASH in 4-week-old mdx quadriceps. (B) The percent accuracy of QuantiMus and SMASH to detect CNFs in (A). (C) The average CSA (μm2) of CNFs detected by manual measurement (FIJI), QuantiMus, or SMASH. (D) The percent accuracy of QuantiMus and SMASH in measuring the CSA of detected CNFs compared to FIJI. Connected data points are indicative of a single image analyzed by each method. Five representative fields taken from two mice were used for analysis. **p < 0.01 using a two-way repeated measures ANOVA with a multiple comparison test (main column effect) (A,C) or an paired two-tailed t-test (B,D). Statistics are compared to FIJI (A,C) or QM (B,D).
Figure 9
Figure 9
Myofiber typing of mouse and human muscle. (A) Representative image of WT mouse quadriceps cross-sections stained with antibodies against myosin heavy chain-specific isoforms. Blue = type I, green = type IIa, red = type IIb. Fibers with no isoform present are defined as type IIx. (B) The proportion of each myofiber type. (C) The average (Avg) cross-sectional area (CSA) of each fiber type. Data are displayed as the average ± SEM from full section measurements of four WT mice. A total of 25,757 fibers were measured. (D) Representative image of human cross-sections stained with antibodies against myosin heavy chain-specific isoforms. Blue = type I, green = type IIa, red = type IIx. (E,F) The proportion of each fiber type in human biceps brachii (Bicep) or gastrocnemius (Gastroc). (G,H) The Avg CSA of each fiber type in both muscle groups. Data are measured from full cross-sections and are displayed as the average ± SEM CSA of each patient sample (G,H). 1,488 (Biceps) and 2,036 (Gastroc) fibers were measured. Scale bars = 100 (A) or 200 (D) μm.
Figure 10
Figure 10
Morphometric analysis of dystrophic pathology in mdx mice. (A) Frequency of injured fibers (% EBD+) in entire quadriceps cross-sections of WT and mdx mice. (B) Histogram of muscle EBD expression showing individual myofiber EBD expression displayed as mean fluorescence intensity (MFI). n = 4 for each group. (C) Representative images of mdx mouse quadriceps cross-sections stained with DAPI (blue), NCAM (green), eMyHC (red), and laminin (white). The percentage of centrally-nucleated [CNF, (D)], eMyHC+ (E), and NCAM+ (F) fibers (of all fibers) in entire WT and mdx quadriceps cross-sections. (G,H) Histogram of eMyHC and NCAM expression showing individual myofiber expression displayed as MFI. Teal = WT, orange = mdx. (I–L) Linear regression analysis comparing eMyHC or NCAM MFI and myofiber CSA (μm2) in WT and mdx mice. Each dot represents a single myofiber. Red-dashed line corresponds to the equation generated by the linear regression analysis. n = 4 for each group. The boxed regions reflect data points that were above the background signal. Scale bar = 100 μm. AU = arbitrary units. Four-week-old mice were used. *p < 0.05, **p < 0.01, ***p < 0.001, and ****p < 0.0001 using an unpaired two-tailed t-test with Welch’s correction.

References

    1. Adamiak K., Duch P., Ślot K. (2016). Object classification using support vector machines with kernel-based data preprocessing. Image Process. Commun. 21, 45–53. 10.1515/ipc-2016-0015 - DOI
    1. Agbulut O., Noirez P., Beaumont F., Butler-Browne G. (2003). Myosin heavy chain isoforms in postnatal muscle development of mice. Biol. cell 95, 399–406. 10.1016/S0248-4900(03)00087-X - DOI - PubMed
    1. Artan Y. (2011). Interactive image segmentation using machine learning techniques. 2011 Can. Conf. Comput. Robot Vis. 264–269. 10.1109/CRV.2011.42 - DOI
    1. Banks G. B., Combs A. C., Odom G. L., Bloch R. J., Chamberlain J. S. (2014). Muscle structure influences utrophin expression in mdx mice. PLoS Genet. 10:e1004431. 10.1371/journal.pgen.1004431, PMID: - DOI - PMC - PubMed
    1. Capkovic K. L., Stevenson S., Johnson M. C., Thelen J. J., Cornelison D. D. W. (2008). Neural cell adhesion molecule (NCAM) marks adult myogenic cells committed to differentiation. Exp. Cell Res. 314, 1553–1565. 10.1016/j.yexcr.2008.01.021, PMID: - DOI - PMC - PubMed