

The Effect of Emotional Valence on Ventricular Repolarization Dynamics Is Mediated by Heart Rate Variability: A Study of QT Variability and Music-Induced Emotions
- PMID: 31849711
- PMCID: PMC6895139
- DOI: 10.3389/fphys.2019.01465
The Effect of Emotional Valence on Ventricular Repolarization Dynamics Is Mediated by Heart Rate Variability: A Study of QT Variability and Music-Induced Emotions
Abstract
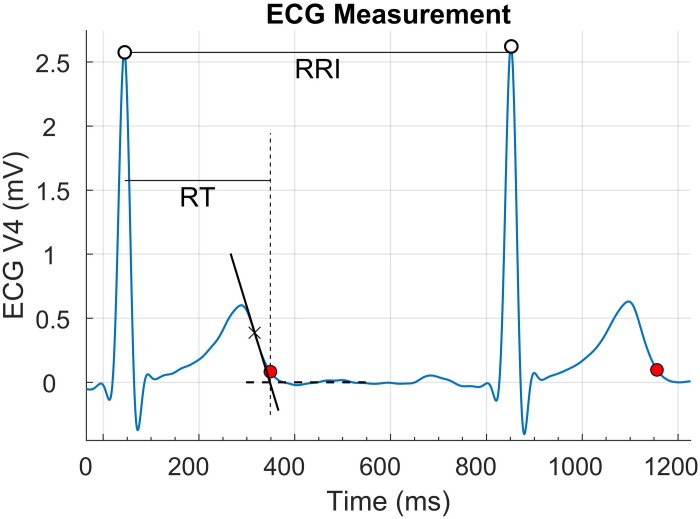
Background: Emotions can affect cardiac activity, but their impact on ventricular repolarization variability, an important parameter providing information about cardiac risk and autonomic nervous system activity, is unknown. The beat-to-beat variability of the QT interval (QTV) from the body surface ECG is a non-invasive marker of repolarization variability, which can be decomposed into QTV related to RR variability (QTVrRRV) and QTV unrelated to RRV (QTVuRRV), with the latter thought to be a marker of intrinsic repolarization variability.
Aim: To determine the effect of emotional valence (pleasant and unpleasant) on repolarization variability in healthy volunteers by means of QTV analysis.
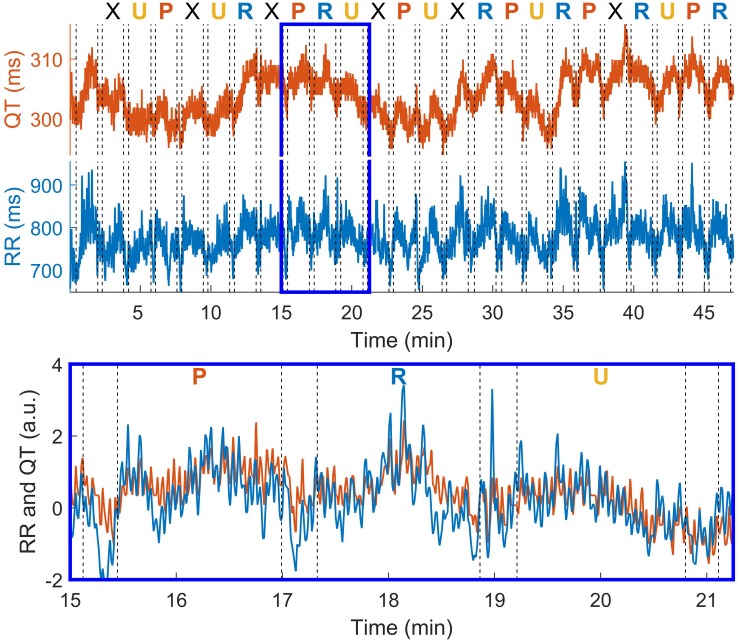
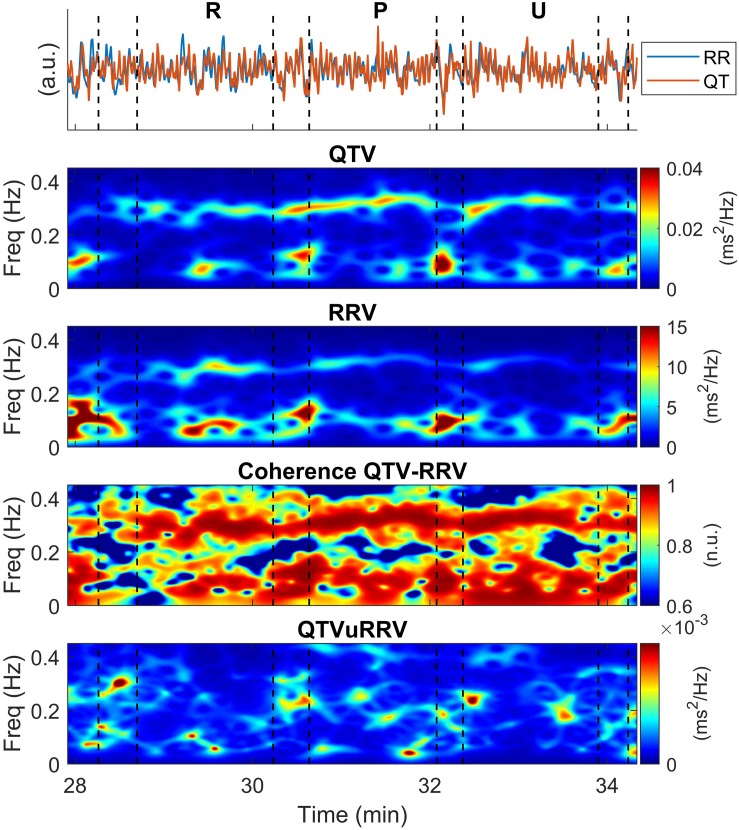
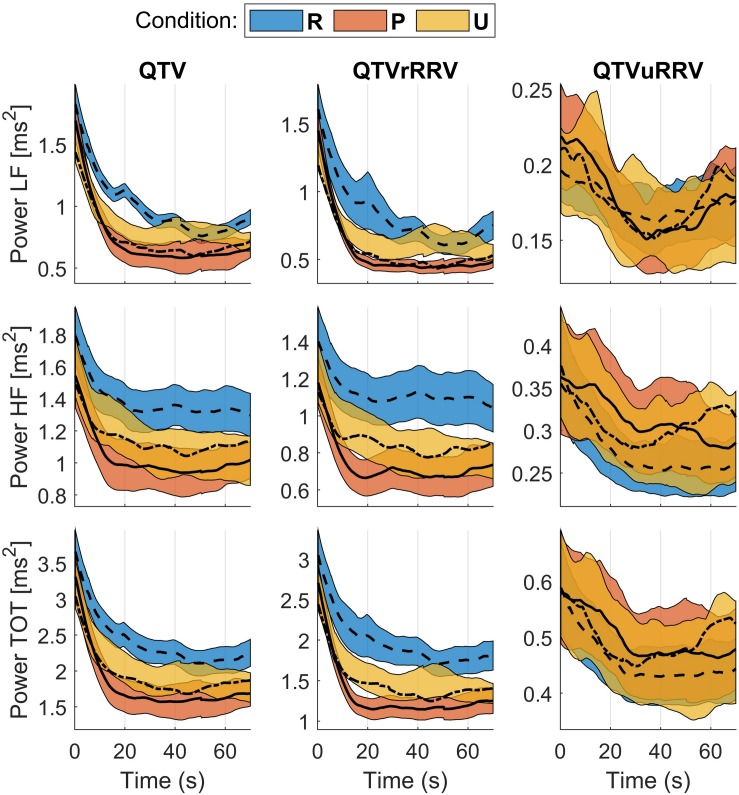
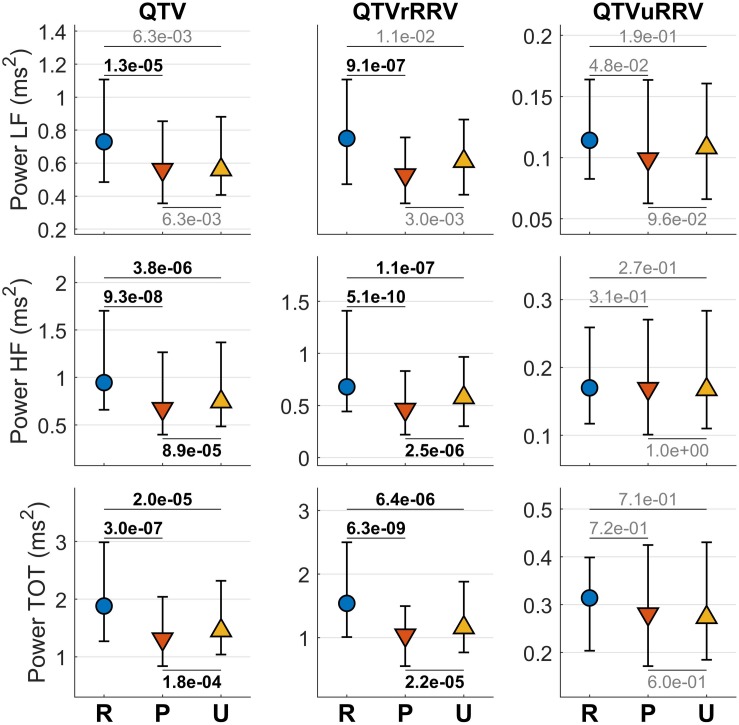
Methods: 75 individuals (24.5 ± 3.2 years, 36 females) without a history of cardiovascular disease listened to music-excerpts that were either felt as pleasant (n = 6) or unpleasant (n = 6). Excerpts lasted about 90 s and were presented in a random order along with silent intervals (n = 6). QTV and RRV were derived from the ECG and the time-frequency spectrum of RRV, QTV, QTVuRRV and QTVrRRV as well as time-frequency coherence between QTV and RRV were estimated. Analysis was performed in low-frequency (LF), high frequency (HF) and total spectral bands.
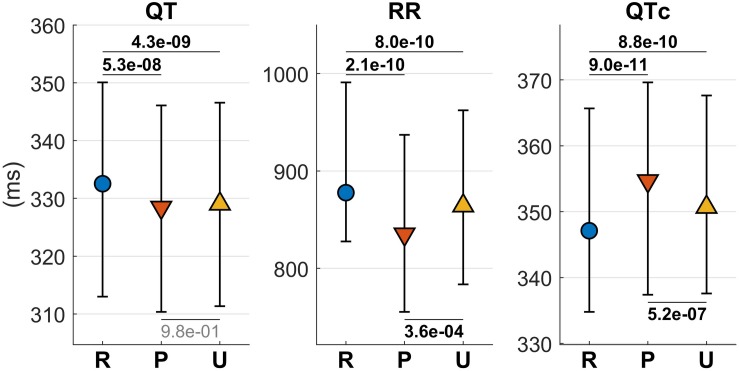
Results: The heart rate-corrected QTV showed a small but significant increase from silence (median 347/interquartile range 31 ms) to listening to music felt as unpleasant (351/30 ms) and pleasant (355/32 ms). The dynamic response of QTV to emotional valence showed a transient phase lasting about 20 s after the onset of each musical excerpt. QTV and RRV were highly correlated in both HF and LF (mean coherence ranging 0.76-0.85). QTV and QTVrRRV decreased during listening to music felt as pleasant and unpleasant with respect to silence and further decreased during listening to music felt as pleasant. QTVuRRV was small and not affected by emotional valence.
Conclusion: Emotional valence, as evoked by music, has a small but significant effect on QTV and QTVrRRV, but not on QTVuRRV. This suggests that the interaction between emotional valence and ventricular repolarization variability is mediated by cycle length dynamics and not due to intrinsic repolarization variability.
Keywords: QT variability; emotional valence; heart rate variability; music-induced emotions; repolarization; time-frequency.
Copyright © 2019 Orini, Al-Amodi, Koelsch and Bailón.
Figures
References
-
- Baumert M., Porta A., Vos M. A., Malik M., Couderc J. P., Laguna P., et al. (2016). QT interval variability in body surface ECG: measurement, physiological basis, and clinical value: position statement and consensus guidance endorsed by the European Heart Rhythm Association jointly with the ESC Working Group on cardiac cellular electroph. Europace 18 925–944. 10.1093/europace/euv405 - DOI - PMC - PubMed
-
- Cerruto G., Mainardi L., Koelsch S., Orini M. (2017). The periodic repolarization dynamics index identifies changes in ventricular repolarization oscillations associated with musicinduced emotions. Comput. Cardiol. 44 2–5. 10.22489/CinC.2017.259-372 - DOI
-
- Child N., Hanson B., Bishop M., Rinaldi C. A., Bostock J., Western D., et al. (2014). Effect of mental challenge induced by movie clips on action potential duration in normal human subjects independent of heart rate. Circ. Arrhythmia Electrophysiol. 7 518–523. 10.1161/CIRCEP.113.000909 - DOI - PMC - PubMed
-
- Cohen L. (1989). Time-frequency distributions-a review. Proc. IEEE 77 941–981. 10.1109/5.30749 - DOI
LinkOut - more resources
Full Text Sources
Research Materials
Miscellaneous