. 2019 Nov 28:10:2769.
doi: 10.3389/fmicb.2019.02769. eCollection 2019.

Physiology and Transcriptional Analysis of (p)ppGpp-Related Regulatory Effects in Corynebacterium glutamicum

Affiliations

Physiology and Transcriptional Analysis of (p)ppGpp-Related Regulatory Effects in Corynebacterium glutamicum

Matthias Ruwe et al. Front Microbiol. .

Abstract

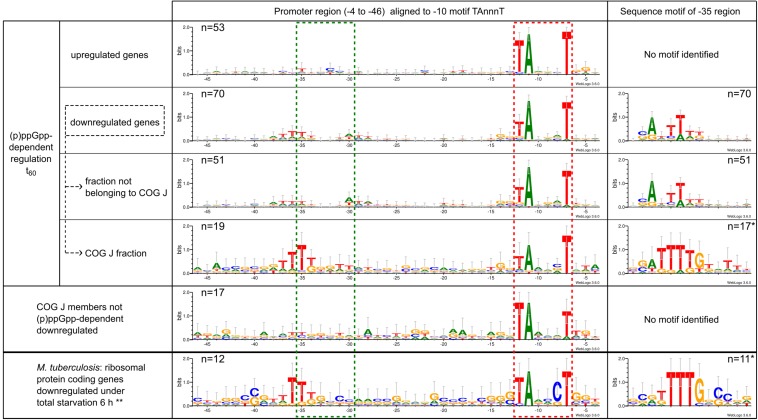
The alarmone species ppGpp and pppGpp are elementary components of bacterial physiology as they both coordinate the bacterial stress response and serve as fine-tuners of general metabolism during conditions of balanced growth. Since the regulation of (p)ppGpp metabolism and the effects of (p)ppGpp on cellular processes are highly complex and show massive differences between bacterial species, the underlying molecular mechanisms have so far only been insufficiently investigated for numerous microorganisms. In this study, (p)ppGpp physiology in the actinobacterial model organism Corynebacterium glutamicum was analyzed by phenotypic characterization and RNAseq-based transcriptome analysis. Total nutrient starvation was identified as the most effective method to induce alarmone production, whereas traditional induction methods such as the addition of serine hydroxamate (SHX) or mupirocin did not show a strong accumulation of (p)ppGpp. The predominant alarmone in C. glutamicum represents guanosine tetraphosphate, whose stress-associated production depends on the presence of the bifunctional RSH enzyme Rel. Interestingly, in addition to ppGpp, another substance yet not identified accumulated strongly under inducing conditions. A C. glutamicum triple mutant (ΔrelrelSrelH) unable to produce alarmones [(p)ppGpp0 strain] exhibited unstable growth characteristics and interesting features such as an influence of illumination on its physiology, production of amino acids as well as differences in vitamin and carotenoid production. Differential transcriptome analysis using RNAseq provided numerous indications for the molecular basis of the observed phenotype. An evaluation of the (p)ppGpp-dependent transcriptional regulation under total nutrient starvation revealed a complex interplay with the involvement of ribosome-mediated transcriptional attenuation, the stress-responsive sigma factors σB and σH and transcription factors such as McbR, the master regulator of sulfur metabolism. In addition to the differential regulation of genes connected with various cell functions, the transcriptome analysis revealed conserved motifs within the promoter regions of (p)ppGpp-dependently and independently regulated genes. In particular, the representatives of translation-associated genes are both (p)ppGpp-dependent transcriptionally downregulated and show a highly conserved and so far unknown TTTTG motif in the -35 region, which is also present in other actinobacterial genera.

Keywords: (p)ppGpp; Rel; discriminator; promoter; stress response; stringent response.


Figures

FIGURE 1
FIGURE 1
Synthesis of hyperphosphorylated nucleotides in E. coli and C. glutamicum after SHX treatment. E. coli cells were labeled in MMM, C. glutamicum cells in CGXII medium (low P) for 3 h with 54 μCi/ml [32P]orthophosphate. Subsequently the cultures were treated with 1 mg/L SHX and 0.5 mg/L L-valine, as described by Lemos et al. (2007) and further incubated for 30 min. For nucleotide extraction, the cell pellets from treated samples and the untreated controls were resuspended in 6 M formic acid, shock-frozen in liquid nitrogen and subjected to five freeze-thaw cycles. 1.5 μL of the clarified supernatant were applied to PEI cellulose TLC-plates and developed in 1.5 M KH2PO4 solution (pH 3.4). 32P-labeled pGpp, ppGpp and pppGpp standards were prepared enzymatically by RelS catalyzed pyrophosphorylation of GMP, GDP, and GTP using [γ-32P]ATP and applied together with [γ-32P]ATP and [α-32P]GTP.
FIGURE 2
FIGURE 2
Synthesis of hyperphosphorylated nucleotides in C. glutamicum after treatment with various stressors or exposure to nutrient deficiency. C. glutamicum cells were labeled in CGXII medium (low P), containing all proteinogenic amino acids (50 mg/L each), for 3 h with 54 μCi/ml [32P]orthophosphate. The cultures were treated with the indicated stressors, respectively centrifuged and subsequently resuspended in starvation solutions, as specified. All samples were further incubated for 30 min. For nucleotide extraction, the cell pellets were resuspended in 6 M formic acid, shock-frozen in liquid nitrogen and subjected to five freeze-thaw cycles. 1.5 μL of the clarified supernatant were applied to PEI cellulose TLC-plates and developed in 1.5 M KH2PO4 solution (pH 3.4). 32P-labeled pGpp, ppGpp. and pppGpp standards were prepared enzymatically by RelS catalyzed pyrophosphorylation of GMP, GDP, and GTP using [γ-32P]ATP.
FIGURE 3
FIGURE 3
Synthesis of hyperphosphorylated nucleotides in C. glutamicum strains with deletions of (p)ppGpp metabolism associated genes after exposure to total starvation. C. glutamicum cells were labeled in CGXII medium (low P), containing all proteinogenic amino acids (50 mg/L each), for 3 h with 54 μCi/ml [32P]orthophosphate. The cultures were centrifuged and subsequently resuspended in starvation solution. All samples were further incubated for 30 min under constant conditions. For nucleotide extraction, the cell pellets from treated samples and the untreated controls were resuspended in 6 M formic acid, shock-frozen in liquid nitrogen and subjected to five freeze-thaw cycles. 1.5 μL of the clarified supernatant were applied to PEI cellulose TLC-plates and developed in 1.5 M KH2PO4 solution (pH 3.4). 32P-labeled pGpp, ppGpp, and pppGpp standards were prepared enzymatically by RelS catalyzed pyrophosphorylation of GMP, GDP, and GTP using [γ-32P]ATP.
FIGURE 4
FIGURE 4
MA-plot of transcriptome data from early exponential growth phase: C. glutamicum CR099 ΔrelΔrelSΔrelH vs. C. glutamicum CR099. Visualization of transcriptomic data from three biological replicates each, transformed onto M (log2 fold change) and A (mean average) values, using DESeq2 (Love et al., 2014). Significantly differentially transcribed genes are labeled in red (M: > 1; padj: < 0.01) and green (M: < −1; padj: < 0.01), respectively. Genes below the fold change threshold with a significant probability value (1 > M > 1; padj: < 0.01) are visualized in black and genes with a padj: > 0.01 in gray. Representatives of the cys, crt, and glt operons are highlighted by colored borders: cys: dark red; crt: dark green; glt: yellow.
FIGURE 5
FIGURE 5
Analysis of relevant parameters for the cultivation of C. glutamicum CR099 and C. glutamicum CR099 ΔrelΔrelSΔrelH in dependence of illumination. Both strains were cultured in CGXII medium with supplementation of all proteinogenic amino acids (50 mg/L each) for 44 h under light and dark conditions. Due to considerable differences within the three biological replicates of the (p)ppGpp0 strain, the mean values as well as the corresponding individual measurements are plotted. (A) OD600 values and decaprenoxanthin concentration, determined by HPLC analysis and normalized to the cell weight used for extraction. Due to the unavailability of standards, the decaprenoxanthin concentration was calculated as ß-carotene equivalent. (B) L-glutamate, L-alanine and L-valine concentrations in supernatant, determined by OPA derivatization and HPLC measurement. (C) Supernatant concentration of water-soluble vitamins Ca-pantothenate and riboflavin, analyzed by LC-MS/MS measurement. ∗∗ Since the pantothenate concentration in two out of three replicates was below the limit of detection, only the single measured value is indicated without a corresponding error. (D) Concentrations of pyruvate, homoserine, malic acid, and α-ketoglutarate in supernatant, determined by methoxymation and silylation and subsequent GC-MS measurement. Metabolite values were normalized to the internal standard ribitol and illustrated as relative abundance, compared to the parental strain values.
FIGURE 6
FIGURE 6
Principal component analysis (PCA) and over-representation analysis (ORA) of the RNAseq data from total starvation analysis of CR099 and CR099 ΔrelΔrelSΔrelH. (A) PCA of pooled biological triplicates for all time points sampled. (B) PCA of three biological replicates from three sampling points, prior to stress exposure and after 15 or 60 min of total starvation. Related data points of t0, t15, and t60 are highlighted. Read counts were determined using ReadXplorer 2 (Hilker et al., 2016). After data normalization using DESeq2, PCA analysis was performed with R (Love et al., 2014; R Core Team, 2018). (C) Over-representation analysis (ORA) of the differentially regulated genes with respect to their assignment to KEGG-pathways using DAVID 6.7 (Huang et al., 2009a, b).
FIGURE 7
FIGURE 7
Venn diagrams of differentially regulated genes between parental strain CR099 and (p)ppGpp0 mutant CR099 ΔrelΔrelSΔrelH for two stress exposure durations. For both strains, the stress-induced change in transcript levels was determined in relation to the unstressed initial state. (A) Venn diagrams of individual stress exposure durations. (B) Combined Venn diagram of both strains and stress exposure durations. Individual Venn diagram elements represent the genes differentially up- or downregulated in the respective time points (t15: left; t60: right) and strain backgrounds (CR099: bottom; CR099 ΔrelΔrelSΔrelH: top). The numbers of positively regulated genes are shown in green and the downregulated genes in red. Differentially regulated genes of all subgroups are listed comprehensively with their corresponding log2 ratios (M-values) in Supplementary Tables S3–S13.
FIGURE 8
FIGURE 8
Initial NTP (iNTP) distribution and sequence logos of the −10 motif within selected differentially regulated groups of total starvation analysis between wild type strain CR099 and (p)ppGpp-devoid mutant ΔrelΔrelSΔrelH. The percentage composition of the nucleic acid at position +1 (iNTP) is shown in the form of a pie chart: green: ATP; red: UTP; blue: CTP; yellow: GTP. The −10 motif was identified using Improbizer (Ao et al., 2004) and the corresponding sequence was displayed with Weblogo3 (Crooks et al., 2004) as sequence logo from position −18 to −4. The stack height corresponds to the sequence conservation, measured in bits, and the height of each letter corresponds to the relative frequency of the corresponding nucleic acid at that position. The green box corresponds to the localization of the extended −10 motif (Barne et al., 1997) and the red box illustrates to the position of the −10 motif extension, which has been identified for σB dependent promoters (Ehira et al., 2008) Since no Improbizer-motif of the −10 region was found by Improbizer due to the small number of samples, the predicted −10 motif localizations of the original data were used (Pfeifer-Sancar et al., 2013; Albersmeier et al., 2017).
FIGURE 9
FIGURE 9
Promoter sequence characteristics of C. glutamicum gene showing similar transcriptional regulation in the context of (p)ppGpp-dependent response to starvation stress. The −10 motif was identified using Improbizer (Ao et al., 2004) and the sequence aligned with this hexamer was displayed with Weblogo3 (Crooks et al., 2004) as sequence logo from position −46 to −4. The stack height corresponds to the sequence conservation, measured in bits, and the height of each letter corresponds to the relative frequency of the corresponding nucleic acid at that position. The location of the −10 region is marked as a red dotted box and the −35 region as a green dotted box. In addition, the Improbizer tool was used for the identification of conserved −35 motifs. The respective region is also illustrated as a sequence logo after alignment of the promoter sequences to the identified motif. Promotor sequences for which no −35 motif could be identified by Improbizer were not taken into account for the presentation of the −35 motif, resulting in a reduced sample size. ∗∗Ribosomal proteins showing negative transcriptional regulation in M. tuberculosis WT after 6 h of total starvation exposure (Dahl et al., 2003); TSS detection was based on a 5′ enriched RNAseq dataset by Schneefeld et al. (2017).

References

    1. Albersmeier A., Pfeifer-Sancar K., Rückert C., Kalinowski J. (2017). Genome-wide determination of transcription start sites reveals new insights into promoter structures in the actinomycete Corynebacterium glutamicum. J. Biotechnol. 257 99–109. 10.1016/j.jbiotec.2017.04.008 - DOI - PubMed
    1. Ao W., Gaudet J., Kent W. J., Muttumu S., Mango S. E. (2004). Environmentally induced foregut remodeling by PHA-4/FoxA and DAF-12/NHR. Science 305 1743–1746. 10.1126/science.1102216 - DOI - PubMed
    1. Atkinson G. C., Tenson T., Hauryliuk V. (2011). The RelA/SpoT homolog (RSH) superfamily: distribution and functional evolution of ppGpp synthetases and hydrolases across the tree of life. PLoS One 6:e23479. 10.1371/journal.pone.0023479 - DOI - PMC - PubMed
    1. Barne K. A., Bown J. A., Busby S. J., Minchin S. D. (1997). Region 2.5 of the Escherichia coli RNA polymerase sigma70 subunit is responsible for the recognition of the ‘extended-10’ motif at promoters. EMBO J. 16 4034–4040. 10.1093/emboj/16.13.4034 - DOI - PMC - PubMed
    1. Baumgart M., Unthan S., Rückert C., Sivalingam J., Grünberger A., Kalinowski J., et al. (2013). Construction of a prophage-free variant of Corynebacterium glutamicum ATCC 13032 for use as a platform strain for basic research and industrial biotechnology. Appl. Environ. Microbiol. 79 6006–6015. 10.1128/AEM.01634-13 - DOI - PMC - PubMed

LinkOut - more resources