. 2019 Nov 29:10:2783.
doi: 10.3389/fmicb.2019.02783. eCollection 2019.

K5 Capsule and Lipopolysaccharide Are Important in Resistance to T4 Phage Attack in Probiotic E. coli Strain Nissle 1917

Affiliations

K5 Capsule and Lipopolysaccharide Are Important in Resistance to T4 Phage Attack in Probiotic E. coli Strain Nissle 1917

Manonmani Soundararajan et al. Front Microbiol. .

Abstract

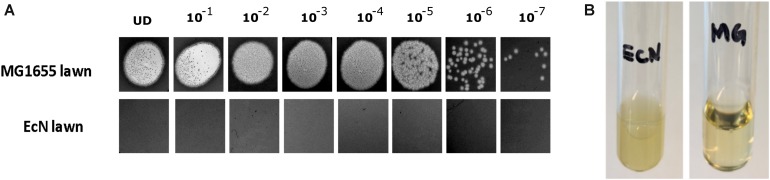
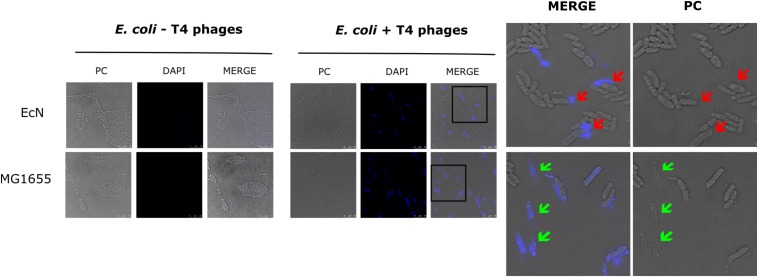
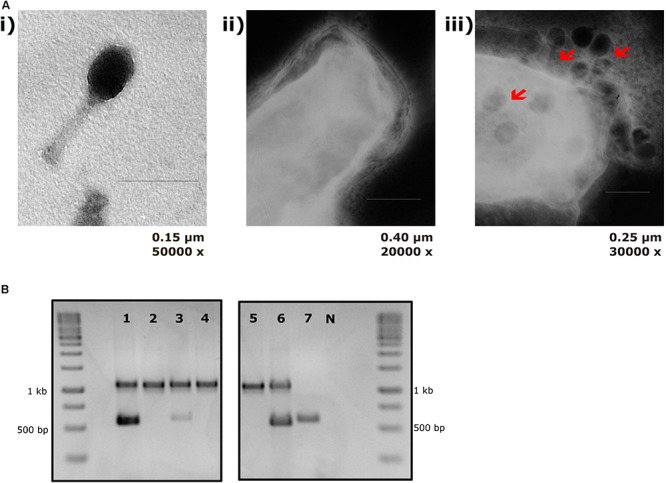
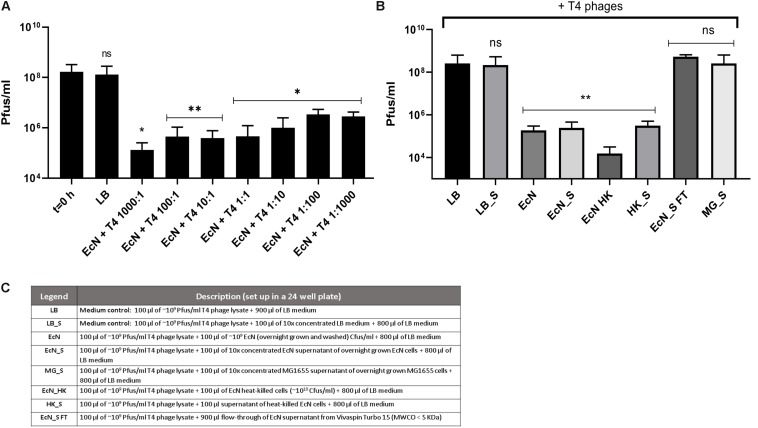
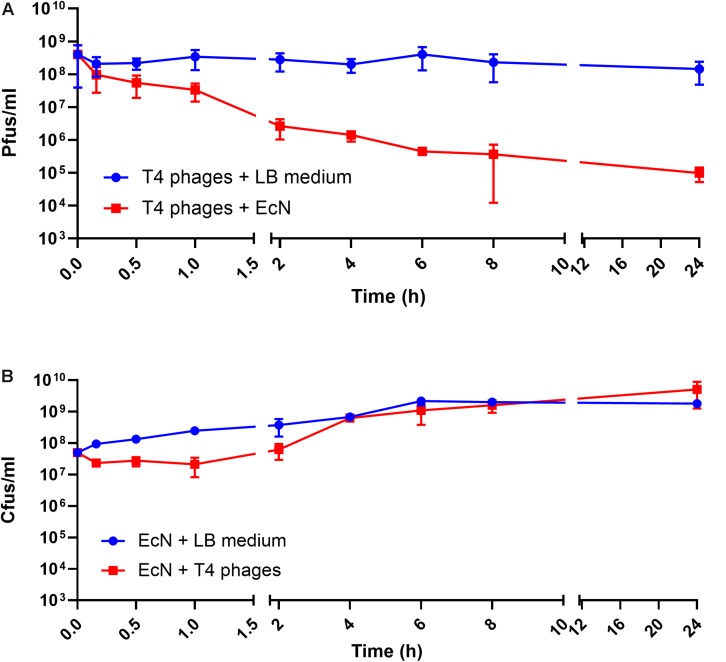
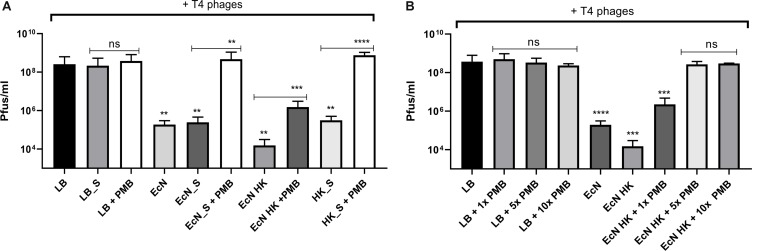
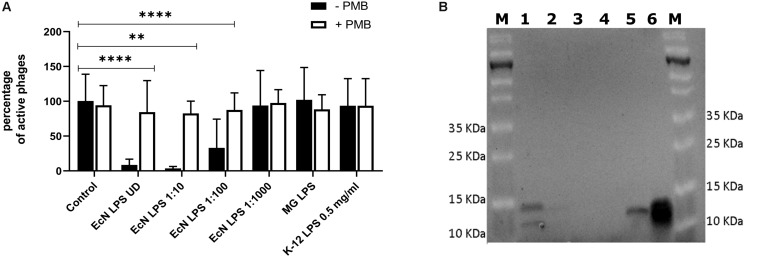
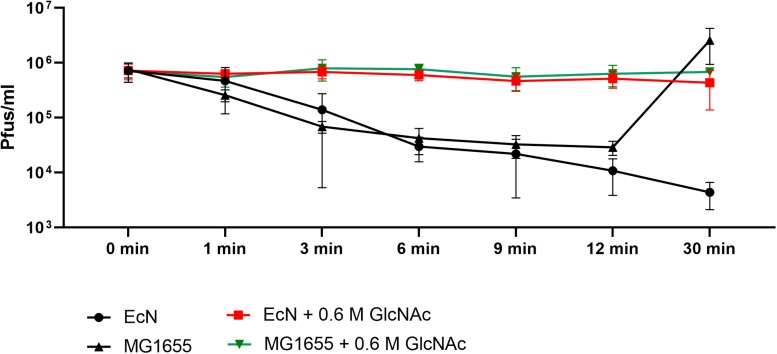
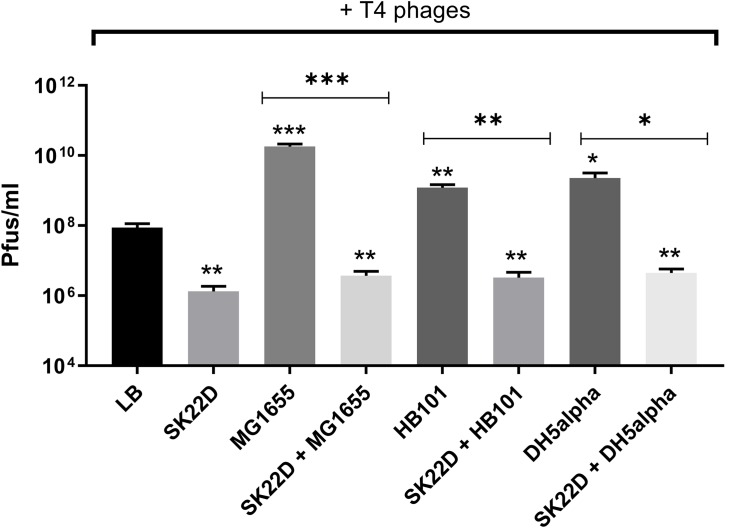
Rapidly growing antibiotic resistance among gastrointestinal pathogens, and the ability of antibiotics to induce the virulence of these pathogens makes it increasingly difficult to rely on antibiotics to treat gastrointestinal infections. The probiotic Escherichia coli strain Nissle 1917 (EcN) is the active component of the pharmaceutical preparation Mutaflor® and has been successfully used in the treatment of gastrointestinal disorders. Gut bacteriophages are dominant players in maintaining the microbial homeostasis in the gut, however, their interaction with incoming probiotic bacteria remains to be at conception. The presence of bacteriophages in the gut makes it inevitable for any probiotic bacteria to be phage resistant, in order to survive and successfully colonize the gut. This study addresses the phage resistance of EcN, specifically against lytic T4 phage infection. From various experiments we could show that (i) EcN is resistant toward T4 phage infection, (ii) EcN's K5 polysaccharide capsule plays a crucial role in T4 phage resistance and (iii) EcN's lipopolysaccharide (LPS) inactivates T4 phages and notably, treatment with the antibiotic polymyxin B which neutralizes the LPS destroyed the phage inactivation ability of isolated LPS from EcN. Combination of these identified properties in EcN was not found in other tested commensal E. coli strains. Our results further indicated that N-acetylglucosamine at the distal end of O6 antigen in EcN's LPS could be the interacting partner with T4 phages. From our findings, we have reported for the first time, the role of EcN's K5 capsule and LPS in its defense against T4 phages. In addition, by inactivating the T4 phages, EcN also protects E. coli K-12 strains from phage infection in tri-culture experiments. Our research highlights phage resistance as an additional safety feature of EcN, a clinically successful probiotic E. coli strain.

Keywords: E. coli Nissle 1917; K5 capsule; Mutaflor; T4 phages; gastrointestinal infections; lipopolysaccharide; phage resistance; probiotics.


Figures

FIGURE 1
FIGURE 1
T4 phages sensitivity test for E. coli strains MG1655 and EcN by (A) phage plaque assay: 10 μl of serially diluted [undiluted (UD) to 10– 7 Pfus/ml] T4 phage lysate was spotted on either MG1655 or EcN lawn in 0.7% LB agar and incubated at 37°C for 24 h, static. (B) Liquid culture assay: 100 μl of 109 Pfus/ml T4 phage lysate was added to mid-log growing phase EcN or MG1655 culture (OD600∼0.5) and incubated at 37°C for 4 h, 180 rpm. Imaging was performed with Canon PowerShot SX260 HS and processed with ImageJ 1.50i.
FIGURE 2
FIGURE 2
Confocal micrograph showing intact EcN cells after incubation with T4 phages: E. coli cells (EcN or MG1655) were mixed with 100 μl of DAPI (0.5 μg/ml) stained T4 lysate or medium at ratio of E. coli: T4∼10:1 and incubated on ice for 30 min, followed by incubation at 37°C for 5 min. Imaging was performed at 100× magnification as described in the “Materials and Methods” section. PC: phase contract channel, DAPI: DAPI channel, MERGE: PC + DAPI. E. coli -T4 phages (left): EcN or MG1655 cells incubated with medium +0.5 μg/ml DAPI, E. coli +T4 phages (middle): EcN or MG1655 cells incubated with T4 phages +0.5 μg/ml DAPI. In zoomed-in version, red arrows point out intact EcN cells, DAPI signal (blue) around the cells (top row) and green arrows point out lysed MG1655 cells, DAPI signal (blue) inside the cells (bottom row).
FIGURE 3
FIGURE 3
T4 phage attachment to EcN cells: (A) Transmission electron micrograph displaying T4 phages attached to EcN cells: T4 phages were incubated with E. coli (100:1) at 37°C for 2 h and then fixed with 0.5% glutaraldehyde and stained with 0.5% uranyl acetate. Imaging was performed in TEM at different magnifications. Length of the bar is mentioned under each picture. (i) T4 phage incubated with medium (ii) EcN incubated with medium (iii) EcN incubated with T4 phages and the red arrows point out the T4 phages that are attached to EcN cells. (B) Localization of T4 phage DNA in EcN after co-incubation by T4 phage specific PCR: The pellet and the supernatant of EcN incubated with T4 phages for 24 h were used as a template (2 μl/each) in a T4 specific PCR with the primer pair T4_ndd_F and T4_ndd_R (580 bp). Plasmid pKD3 (1 μl) was used as internal standard along with primer pair pKD3_F and pKD3_R (1098 bp). T4 specific PCR was performed with 2× PCR Master Mix (Cat no: K0171, Thermo Fischer Scientific) and PCR conditions are mentioned in the Table 3. Lane details 1: EcN + T4 phage_pellet, 2: EcN + LB medium_pellet, 3: EcN + T4 phage_supernatant, 4: EcN_supernatant + LB medium, 5: LB medium control, 6: LB medium + T4 phage, 7: T4 phage control (no pKD3), N: negative control, M: GeneRuler 1 kb DNA Ladder (Cat no: SM0311, Thermo Scientific). The agarose gel pictures displayed here are cropped image of same gel. The image was cropped and presented using ImageJ 1.50i for clear understanding.
FIGURE 4
FIGURE 4
Phage plaque assay plates demonstrating the role of the K5 polysaccharide capsule in EcN’s T4 phage resistance: 10 μl of serially diluted K5 specific phages (top row) or T4 phages (bottom row) were spotted on the lawn of either EcN Δk5 or EcN wildtype in 0.7% LB agar and incubated at 37°C for 24 h, static. Imaging was performed with Canon PowerShot SX260 HS and processed with ImageJ 1.50i.
FIGURE 5
FIGURE 5
Effect of EcN cells and supernatant on T4 phage titer reduction: EcN cells were incubated with T4 phages for 24 h in static at 37°C at various MOI as mentioned in the graph. After 24 h of incubation, the samples were sterile filtered, and Pfus/ml were determined by phage plaque assay (A). EcN samples were processed as described in the “Materials and Methods” section: 8, and processed samples were coincubated with T4 phages as in panel (A) and Pfus/ml were determined by phage plaque assay (B). Legends of the graph B describing the processed E. coli samples are presented in the table in panel (C). The asterisks depict the statistical significance of the different samples when compared to the control with LB medium. ns – not significant, p < 0.05, ∗∗p < 0.01.
FIGURE 6
FIGURE 6
Kinetics of T4 phage inactivation by EcN cells: 100 μl of EcN cells was incubated with 100 μl of T4 phages at an MOI of 1:1 in 1 ml LB medium at 37°C, static. Pfus/ml (A) and Cfus/ml (B) were determined. The blue line indicates Pfus/ml of T4 phages and Cfus/ml of EcN in LB medium, the red line indicates Pfus/ml of T4 phages incubated with EcN cells and Cfus/ml of EcN incubated with T4 phages.
FIGURE 7
FIGURE 7
T4 phage inactivation by differentially treated EcN samples: Graph (A,B) illustrate the results of coincubation studies performed under various conditions as described: processed EcN samples were further treated with 25 μg/ml polymyxin B (PMB) for 1 h at 37°C and used for the coincubation studies. Pfus/ml were determined after 24 h at 37°C using standard phage plaque assay (A). Legends of the graph are described in Figure 5C. The heat-killed EcN cells were further treated with increasing concentration of PMB: 1× – 25 μg/ml, 5× – 125 μg/ml, 10× – 250 μg/ml. As a control, LB medium was treated with the same concentrations of PMB and used in the incubation. Pfus/ml were determined after 24 h at 37°C using standard phage plaque assay. The asterisks depict the statistical significance of the different samples when compared to the control with LB medium or water. For the samples treated with PMB, the statistical significance was analyzed in comparison to the respective sample without PMB. ns – not significant, ∗∗p < 0.01, ∗∗∗p < 0.001 and ∗∗∗∗p < 0.0001.
FIGURE 8
FIGURE 8
T4 phage inactivation by isolated LPS: 100 μl of LPS isolated from E. coli strains were diluted and were incubated with 100 μl of water (control) or T4 phages ± PMB for 1 h at 37°C and percentage of active phages were determined by the phage plaque assay (A). ECN LPS UD – undiluted LPS isolated from EcN, EcN LPS 1:10 or 1:100 or 1:1000 – serially diluted EcN LPS isolations that were used in the coincubation, MG LPS – LPS undiluted from MG1655, K12 LPS 0.5 mg/ml – commercially available K-12 LPS (Cat no: tlrl-eklps, Invivogen). The asterisks depict the statistical significance of the different samples when compared to the control with water. ns – not significant, ∗∗p < 0.01 and ∗∗∗∗p < 0.0001. (B) The isolated LPS were visualized on 12% TruPAGE Precast Gels (Cat no: PCG2010-10EA, Sigma-Aldrich) and stained with Pro-QEmerald 300 LPS gel stain kit (Cat no: P20495, Thermo Fisher Scientific). [Lane description – M: Page Ruler Prestained Protein Ladder (Cat no: 26616, Thermo Fisher Scientific), 1: EcN LPS UD, 2: EcN LPS 1:10, 3: EcN LPS 1:100, 4: EcN LPS 1:1000, 5: MG1655 LPS, 6: K12 LPS 0.5 mg/ml].
FIGURE 9
FIGURE 9
N-acetylglucosamine inhibits T4 phage adsorption to EcN: Graph depicts the kinetics of T4 phage titer reduction after the addition of T4 phages to the E. coli cultures in the presence and absence of 0.6 M N-acetylglucosamine (GlcNAc). T4 phages were added to mid-log phase (OD600∼0.5) EcN or MG1655 culture at an MOI of 0.01 ± 0.6 M GlcNAc, Pfus/ml were determined at different time points mentioned in the graph by phage plaque assay.
FIGURE 10
FIGURE 10
Interference by EcN on T4 phage infection of K-12 strains: T4 phages were incubated in mono; co; or tri-cultures with the microcin negative EcN strain SK22D and/or the K-12 strains MG1655 or HB101 or DH5α (MOI of 1:1:1) at 37°C for 24 h, static and Pfus/ml were determined by phage plaque assay. LB: control (T4 phages + LB medium). The asterisks on the bar depict the statistical significance of the different samples when compared to the control with LB medium and the asterisks on the lines depict the statistical significance of different cocultures when compared to their respective tri-cultures. p < 0.05, ∗∗p < 0.01, and ∗∗∗p < 0.001.

References

    1. Abedon S. T. (2017). Phage “delay” towards enhancing bacterial escape from biofilms: a more comprehensive way of viewing resistance to bacteriophages. AIMS Microbiol. 3 186–226. 10.3934/microbiol.2017.2.186 - DOI - PMC - PubMed
    1. Arber W., Hattman S., Dussoix D. (1963). On the host-controlled modification of bacteriophage Lambda. Virology 21 30–35. 10.1016/0042-6822(63)90300-3 - DOI - PubMed
    1. Arribas B., Rodriguez-Cabezas M. E., Camuesco D., Comalada M., Bailon E., Utrilla P., et al. (2009). A probiotic strain of Escherichia coli, Nissle 1917, given orally exerts local and systemic anti-inflammatory effects in lipopolysaccharide-induced sepsis in mice. Br. J. Pharmacol. 157 1024–1033. 10.1111/j.1476-5381.2009.00270.x - DOI - PMC - PubMed
    1. Beacham I. R., Picken R. N. (1981). On the receptor for bacteriophage T4 in Escherichia coli K12. Curr. Microbiol. 6 291–293. 10.1007/bf01566879 - DOI
    1. Becattini S., Taur Y., Pamer E. G. (2016). Antibiotic-induced changes in the intestinal microbiota and disease. Trends Mol. Med. 22 458–478. 10.1016/j.molmed.2016.04.003 - DOI - PMC - PubMed