. 2019 Nov 29:10:1510.
doi: 10.3389/fpls.2019.01510. eCollection 2019.

Overexpression of SlOFP20 in Tomato Affects Plant Growth, Chlorophyll Accumulation, and Leaf Senescence

Affiliations

Overexpression of SlOFP20 in Tomato Affects Plant Growth, Chlorophyll Accumulation, and Leaf Senescence

Shengen Zhou et al. Front Plant Sci. .

Abstract

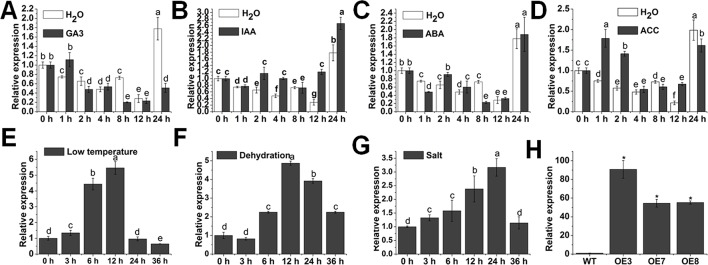
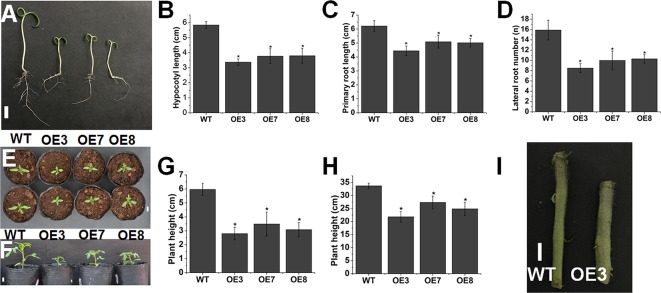
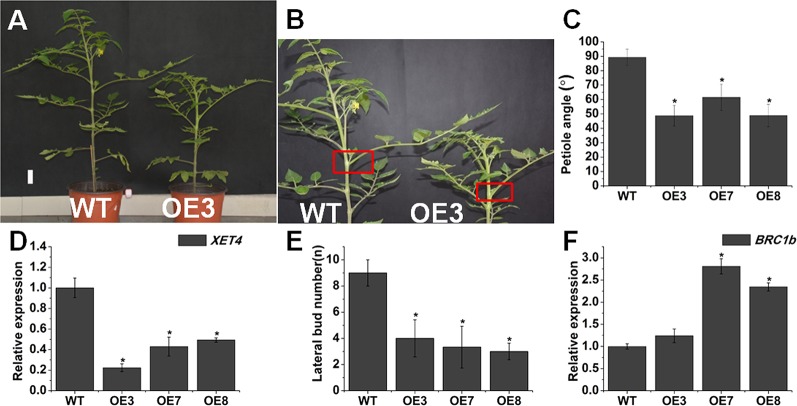
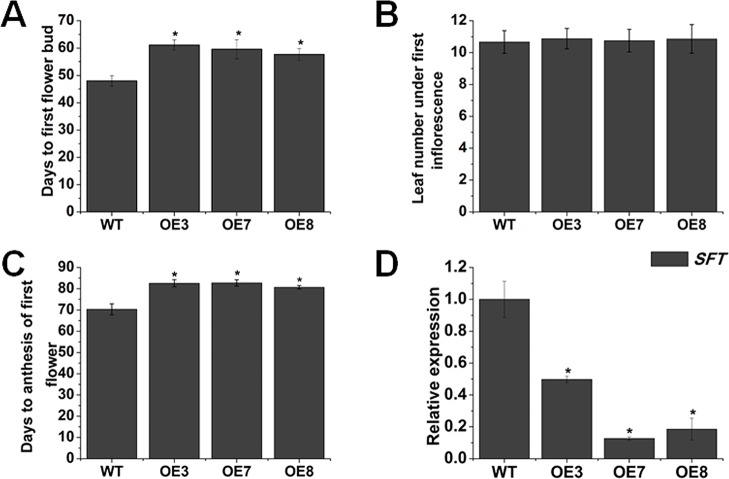
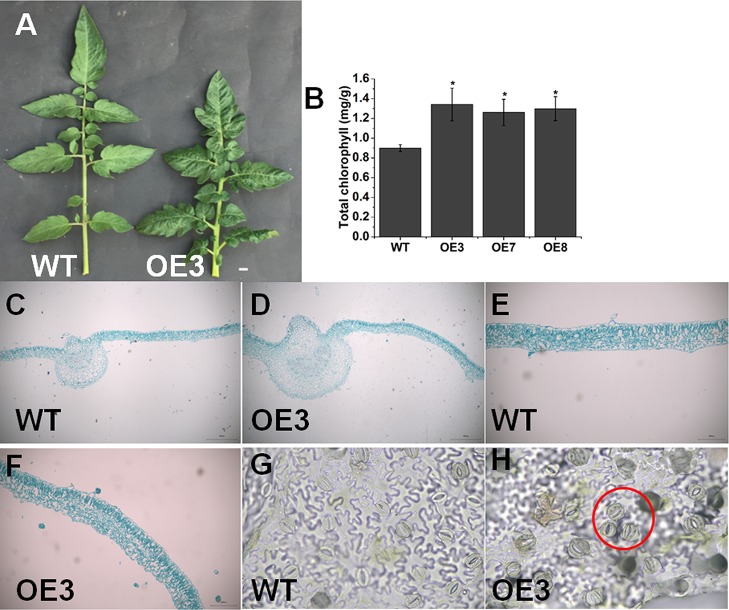
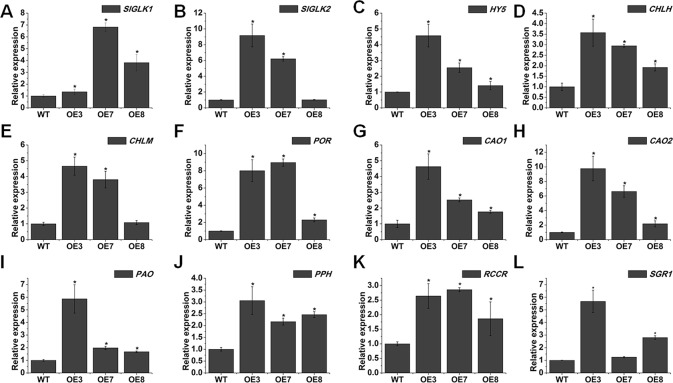
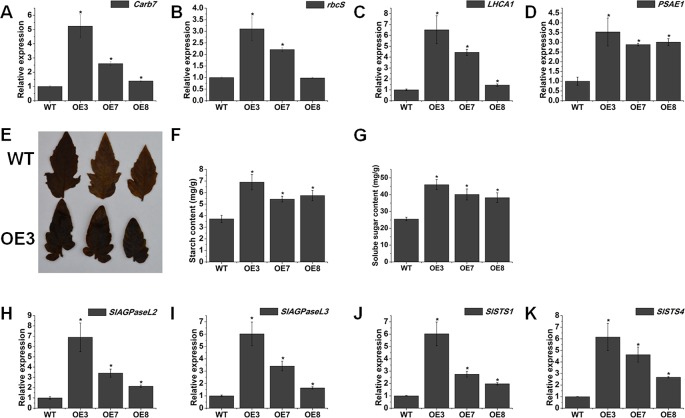
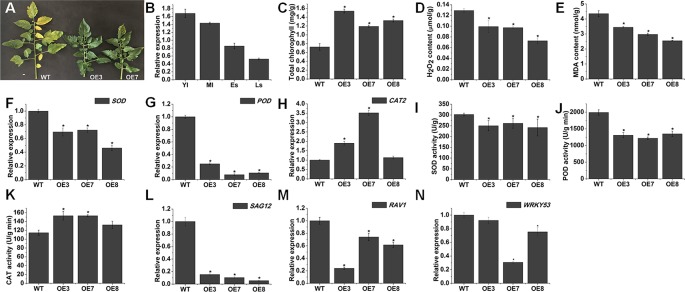
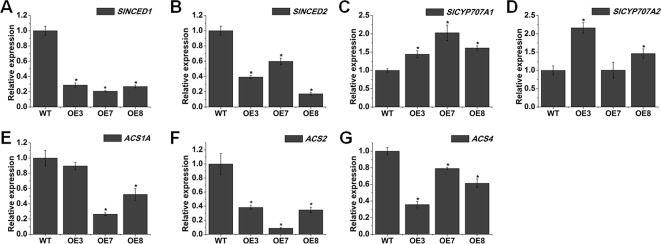
Previous studies have shown that OVATE family proteins (OFPs) participate in various aspects of plant growth and development. How OFPs affect leaf chlorophyll accumulation and leaf senescence has not been reported yet. Here, we found that overexpression of SlOFP20 in tomato not only impacted plant architecture but also enhanced the leaf chlorophyll accumulation and retarded leaf senescence. Gene expression analysis of SlGLK1, SlGLK2, and HY5, encoding transcription factors that are putatively involved in chloroplast development and chlorophyll levels, were significantly up-regulated in SlOFP20-OE lines. Both chlorophyll biosynthesis and degradation genes were distinctly regulated in transgenic plants. Moreover, SlOFP20-OE plants accumulated more starch and soluble sugar than wild-type plants, indicating that an increased chlorophyll content conferred some higher photosynthetic performance in SlOFP20-OE plants. Furthermore, The levels of leaf senescence-related indexes, such as hydrogen peroxide, malondialdehyde, and antioxidant enzymes activities, were differently altered, too. SlOFP20 overexpression repressed the expression of senescence-related genes, SAG12, RAV1, and WRKY53. Moreover, abscisic acid and ethylene synthesis genes were down-regulated in transgenic lines. These results provide new insights into how SlOFP20 regulates chlorophyll accumulation and leaf senescence.

Keywords: OVATE family protein; SlOFP20; chlorophyll; leaf senescence; sugar metabolism.


Figures

Figure 1
Figure 1
Expression patterns of SlOFP20. The expression level of SlOFP20 in response to the phytohormones gibberellic acid (A), indole-3-acetic acid (B), abscisic acid (C), and 1-aminocyclopropane-1-carboxylate (D). The expression of SlOFP20 under low temperature (E), dehydration (F), and salt stress (G). Data are the means ± SD of three independent experiments. Significant differences (P < 0.05) are denoted by different letters. Relative expression profiles of SlOFP20 between WT and SlOFP20-OE lines. Data are the means ± SD of three independent experiments. Asterisks indicate a significant difference (P < 0.05).
Figure 2
Figure 2
Overexpression of SlOFP20 affected plant growth. (A) Seven-day-old seedlings of WT and SlOFP20-OE lines. Bar = 1 cm. (B) Hypocotyl lengths of 7-day-old WT and SlOFP20-OE seedlings. (C) The length of primary root in WT and SlOFP20-OE 7-day-old seedlings. (D) The number of lateral roots in WT and SlOFP20-OE 7-day-old seedlings. Error bars show the standard error between three biological replicates with 10 plants for each replicate performed. Asterisks indicate a significant difference (P < 0.05). (E) Top view of cotyledons from 7-day-old WT and SlOFP20-OE lines. (F) Image of 30-day-old WT and SlOFP20-OE plants. Bar = 1 cm. (G, H).Plant height of WT and SlOFP20-OE plants at 30 days (G) and 60 days (H) after sowing. Error bars show the standard error between three biological replicates with eight plants for each replicate performed. (I) Stems of WT and OE3 plants. Bar = 1 cm.
Figure 3
Figure 3
Overexpression of SlOFP20 restricts leaf inclination and lateral bud outgrowth. (A) Picture of 60-day-old WT and OE3 plants. Bar = 1 cm. (B) The red boxes indicated the petiole angle of the 9th leaf. (C) The petiole angle was determined at 60 days in the ninth leaf with eight plants after sowing. Error bars show the standard error between three biological replicates. Asterisks indicate a significant difference (P < 0.05). (D) The expression level of XET4 in WT and SlOFP20-OE lines. (E) Lateral bud numbers of WT and transgenic plants. At least eight plants were measured for WT and each transgenic line. Error bars show the standard error between three biological replicates. Asterisks indicate a significant difference (P < 0.05). (F) Expression analysis of BRClb in WT and transgenic plants. Each value represents the mean ± SE of three biological replicates. Asterisks indicate a significant difference (P < 0.05).
Figure 4
Figure 4
Overexpression of SlOFP20 restrains the onset of flowering. Analysis of the days to first flower bud (A), leaf number under first inflorescence (B) and (C) days to anthesis of first flower of WT and transgenic plants. Error bars show the standard error between three biological replicates with eight plants for each replicate performed. (D) Expression analysis of SFT in WT and transgenic plants. Each value represents the mean ± SE of three biological replicates. Asterisks indicate a significant difference (P < 0.05).
Figure 5
Figure 5
Overexpression of SlOFP20 alters leaf growth. (A) Comparison of the leaves of WT and OE3 plants. Bar = 1 cm. (B) Total chlorophyll content in mature leaves of WT and transgenic plants. Each value represents the mean ± SE of three biological replicates. Asterisks indicate a significant difference (P < 0.05). (CF) The leaf structure of WT and OE3 mature leaves. Bar = 100 μm. Stoma morphology of WT (G) and OE3 (H) leaves. Bar = 100 μm.
Figure 6
Figure 6
Overexpression of SlOFP20 alters the expression of chloroplast development- and chlorophyll metabolism-related genes. (AC) Quantitative RT-PCR analysis of the expression levels of SlGLK1, SlGLK2, and HY5. (DH) Expression analysis of genes involved in the chlorophyll biosynthesis. in the mature leaves of WT and transgenic plants (IL) qRT-PCR analysis of chlorophyll degradation-related genes in the mature leaves of WT and transgenic plants Each value represents the mean ± SE of three biological replicates. Asterisks indicate a significant difference (P < 0.05).
Figure 7
Figure 7
Ectopic expression of SlOFP20 affects sugar metabolism. (AD) The transcript levels of photosynthesis-related genes. (E) Starch I2/KI staining results for the WT and OE3 leaves. (F, G) Contents of starch and soluble sugar. (HK) Expression analysis of genes involved in starch synthesis. Each value represents the mean ± SE of three biological replicates. Asterisks indicate a significant difference (P < 0.05).
Figure 8
Figure 8
SlOFP20 overexpression delays leaf senescence. (A) Phenotype of delayed leaf senescence in SlOFP20-OE lines. (B) The expression levels of SlOFP20 in the leaves at different developmental stages: young leaves (YL), mature leaves (ML), senescent leaves (SL), and late senescent leaves (LS). (C, D) Comparison of H2O2 and MDA Contents in the senescent leaves of WT and SlOFP20-OE plants. (FH) Comparison of transcript levels of SOD, POD, and CAT2 in the senescent leaves of WT and transgenic plants. (IK). Comparison of SOD, POD, and CAT activities in the senescent leaves of WT and transgenic plants. (LN) Expression of senescence-related genes (SAG12, RAV1, and WRKY53) in the senescent leaves of WT and transgenic plants. Each value represents the mean ± SE of three biological replicates. Asterisks indicate a significant difference (P < 0.05).
Figure 9
Figure 9
Overexpression of SlOFP20 leads to the changes of abscisic acid (ABA)- and ethylene-related genes. (A, B) The expression of ABA biosynthesis genes (SlNCED1 and SlNCED2) between WT and SlOFP20-OE lines. (C, D) The expression of ABA degradation genes (SlCYP707A1 and SlCYP707A2) between WT and SlOFP20-OE lines. (EG) The expression of ethylene biosynthesis genes (ACS1A, ACS2, and ACS4) between WT and SlOFP20-OE lines. Each value represents the mean ± SE of three biological replicates. Asterisks indicate a significant difference (P < 0.05).

References

    1. Apel K., Hirt H. (2004). Reactive oxygen species: metabolism, oxidative stress, and signal transduction. Annu. Rev. Plant Biol. 55, 373–399. 10.1146/annurev.arplant.55.031903.141701 - DOI - PubMed
    1. Arnon D. I. (1949). Copper enzymes in isolated chloroplasts. polyphenoloxidase in Beta vulgaris. Plant Physiol. 24 (1), 1–15. 10.1104/pp.24.1.1 - DOI - PMC - PubMed
    1. Bari R., Jones J. D. (2009). Role of plant hormones in plant defence responses. Plant Mol. Biol. 69 (4), 473–488. 10.1007/s11103-008-9435-0 - DOI - PubMed
    1. Besseau S., Li J., Palva E. T. (2012). WRKY54 and WRKY70 co-operate as negative regulators of leaf senescence in Arabidopsis thaliana. J. Exp. Bot. 63 (7), 2667–2679. 10.1093/jxb/err450 - DOI - PMC - PubMed
    1. Beyer W. F., Jr., Fridovich I. (1987). Assaying for superoxide dismutase activity: some large consequences of minor changes in conditions. Anal. Biochem. 161 (2), 559–566. 10.1016/0003-2697(87)90489-1 - DOI - PubMed

LinkOut - more resources