. 2019 Nov 22:10:1132.
doi: 10.3389/fgene.2019.01132. eCollection 2019.

Copy Number Variation of Satellite III (1q12) in Patients With Schizophrenia

Affiliations

Copy Number Variation of Satellite III (1q12) in Patients With Schizophrenia

Elizaveta S Ershova et al. Front Genet. .

Abstract

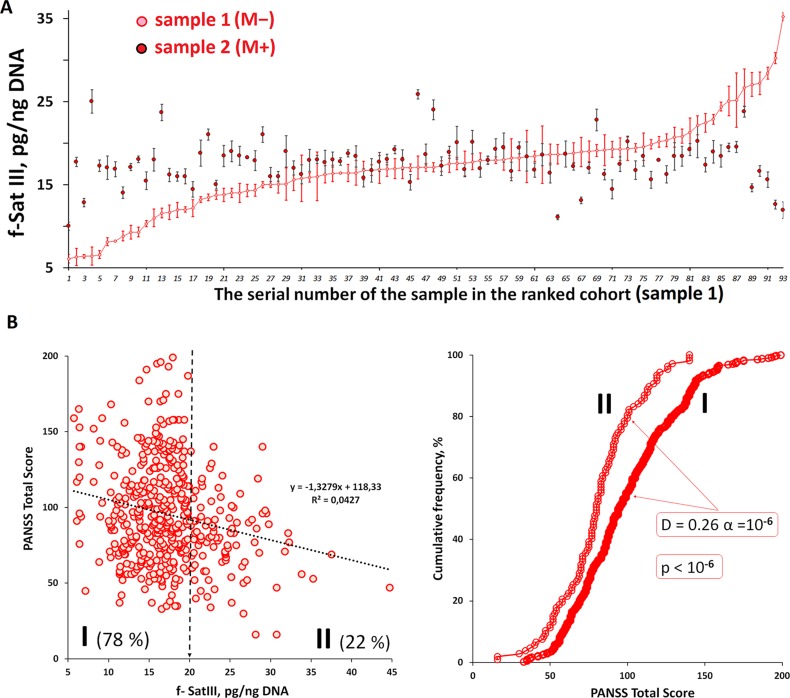
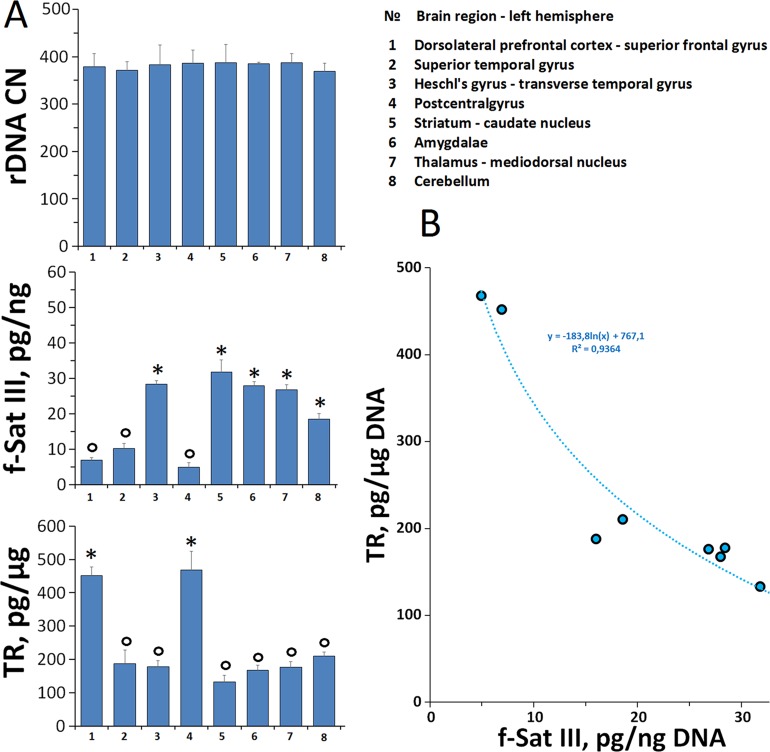
Introduction: It was shown that copy number variations (CNVs) of human satellite III (1q12) fragment (f-SatIII) reflects the human cells response to stress of different nature and intensity. Patients with schizophrenia (SZ) experience chronic stress. The major research question: What is the f-SatIII CNVs in human leukocyte as a function of SZ? Materials and Methods: Biotinylated pUC1.77 probe was used for f-SatIII quantitation in leukocyte DNA by the non-radioactive quantitative hybridization for SZ patients (N = 840) and healthy control (HC, N = 401). SZ-sample included four groups. Two groups: first-episode drug-naïve patients [SZ (M-)] and medicated patients [SZ (M+)]. The medical history of these patients did not contain reliable confirmed information about fetal hypoxia and obstetric complications (H/OCs). Two other groups: medicated patients with documented H/OCs [hypoxia group (H-SZ (M+)] and medicated patients with documented absence of H/OCs [non-hypoxia group (NH-SZ (M+)]. The content of f-SatIII was also determined in eight post-mortem brain tissues of one SZ patient. Results: f-SatIII in human leukocyte varies between 5.7 to 44 pg/ng DNA. f-SatIII CNVs in SZ patients depends on the patient's history of H/OCs. f-SatIII CN in NH-SZ (M+)-group was significantly reduced compared to H-SZ (M+)-group and HC-group (p < 10-30). f-SatIII CN in SZ patients negatively correlated with the index reflecting the seriousness of the disease (Positive and Negative Syndrome Scale). Antipsychotic therapy increases f-SatIII CN in the untreated SZ patients with a low content of the repeat and reduces the f-SatIII CN in SZ patients with high content of the repeat. In general, the SZ (M+) and SZ (M-) groups do not differ in the content of f-SatIII, but significantly differ from the HC-group by lower values of the repeat content. f-SatIII CN in the eight regions of the brain of the SZ patient varies significantly. Conclusion: The content of f-SatIII repeat in leukocytes of the most patients with SZ is significantly reduced compared to the HC. Two hypotheses were put forward: (1) the low content of the repeat is a genetic feature of SZ; and/or (2) the genomes of the SZ patients respond to chronic oxidative stress reducing the repeats copies number.

Keywords: 1q12; CNV; ROS; hypoxia; satellite III; schizophrenia.


Figures

Figure 1
Figure 1
Quantitative f-SatIII determination in the human DNA by NQH. (A) Photo of the membrane fragments with visualized f-SatIII. 50 ng of the denatured DNA samples (three spots for each DNA sample) from the HC-group (N = 31) and SZ-group (N = 30) were applied on the filter. 50 ng of six calibration DNA samples with a known amount of f-SatIII (shown in black rectangles) were also applied to the filter. For the background signal analysis 50 ng of a non-homologous to the DNA probe DNA sample was applied (in blue rectangles). (B) The filter was analyzed with the “Imager 6” soft. The average integral spot intensity and the standard error were determined. (C) The calibration dependence of the average signal intensity on the f-SatIII content in the calibration DNA samples. The equation of the curve that was used to calculate the f-SatIII content in the analyzed DNA samples is given. (D) The result of the quantitative f-SatIII determination in the DNA samples from HC and the SZ-group. For clarity, the data for each group are ranked according to the f-SatIII content.
Figure 2
Figure 2
Analysis of f-SatIII in human genome with the BLAST. (A) BLAST analysis data. The program found 1,000 fragments from the database with more than a few copies of the f-SatIII repeat. Only fragments reliably corresponded to the certain human chromosomes were included in analysis. In the first chromosome, more than 500 fragments with dozens of f-SatIII repeat copies were found. (B) Distribution of f-SatIII homologous fragments on the human chromosomes (indicated by red triangles). Blue triangles indicate areas of the same chromosomes that are associated with the known literature data of CNVs-analysis of patients with mental illness. Blue circles indicate the chromosome with the close location of f-SatIII and the variable regions of the genome associated with mental disorder. (C) The typical example of the f-SatIII FISH analysis in the human lymphocyte nucleus. After hybridization with bio-PUC1.77 probe, biotin was detected using streptavidin conjugate with fluorescein isothiocyanate. Lymphocyte nuclei were stained with propidium iodide.
Figure 3
Figure 3
f-SatIII CNVs in HC- and SZ groups. (A) Dependence of the f-SatIII content in the leukocytes DNA from the year of individual’s birth. The data for 557 mentally healthy people, obtained in the previous study, are given as a control (Ershova et al., 2019b). Vertical lines limit the variation range of SZ patients’ data included in this study (1935–2001). That interval includes data for 401 individuals of the control group. Legends for four SZ patients groups are shown in the left part of the figure. (B) Cumulative distribution of the f-SatIII content in the leukocytes DNA of the SZ individuals and HC born in 1935–1989 and 1990–2001. The significance of the observed differences in the f-SatIII content in the DNA samples of the groups was analyzed using non-parametric Mann–Whitney (p) and Kolmogorov–Smirnov (D and α) statistics. The arrows indicate the compared samples. (C) Cumulative distribution of the f-SatIII content in the leukocytes DNA of the SZ individuals and HC born between 1935 and 2001. Descriptive statistics for the f-SatIII content in the DNA samples of the groups is shown in Table 2 .
Figure 4
Figure 4
Dependence of f-SatIII content in the DNA of patients on antipsychotic therapy and the integrative PANSS score. (A) Change in f-SatIII content in the SZ(M-) patients DNA after a month of antipsychotics therapy. For 93 patients not taking antipsychotics at the admission to the hospital DNA was isolated from leukocytes twice—before the treatment and upon discharge from the hospital. The first test data (sample 1) are ranked for clarity. A significant increase in the f-SatIII DNA content after the treatment was found for samples with initially low f-SatIII content. F-SatIII content reduction was observed for samples with initially high repeat content. (B) The dependence of the integrative PANSS score on the f-SatIII content in the SZ cohort. Linear regression showed a weak negative correlation between f-SatIII and PANSS. In the subgroups of patients with low f-SatIII content (I-subgroup with f-SatIII less than 20 pg/ng DNA) the PANSS results was significantly higher than in the patients with high f-SatIII content (II-subgroup, more than 20 pg/ng). The figure on the right shows the corresponding distributions and statistics.
Figure 5
Figure 5
f-SatIII CNVs in the DNA samples isolated from the different brain regions. (A) DNA was isolated from eight brain regions (1–8, the designation on the right table) of the patient with a continuous paranoid schizophrenia. For the same DNA samples the contents of three tandem repeats (rDNA, f-SatIII and telomere repeat) were determined using NQH method. (o) —samples with the low repeat content, (*)—the samples with a high repeat content. (B) The dependence of the telomere repeat contents on the f-SatIII content.
Figure 6
Figure 6
A hypothetical scheme illustrating the changes in the f-SatIII content during human life. HC: healthy individual. During the aging the content of f-SatIII usually increases. Patient SZ-1: deletion of the genome regions containing f-SatIII (low repeat content). During the aging the content of f-SatIII increases. Patient SZ-2: normal f-SatIII content in the genome; during the aging the content of the repeat decreases. Patient SZ-3 [H-SZ (M+)]: normal f-SatIII content in the genome at the beginning of embryogenesis. Hypoxia and OCs stimulate an increase in repeat content. During the aging the content of the repeat decreases.

References

    1. Barron H., Hafizi S., Andreazza A. C., Mizrahi R. (2017). Neuroinflammation and Oxidative Stress in Psychosis and Psychosis Risk. Int. J. Mol. Sci. 18, pii: E651. 10.3390/ijms18030651 - DOI - PMC - PubMed
    1. Bassett A. S., Scherer S. W., Brzustowicz L. M. (2010). Copy number variations in schizophrenia: critical review and new perspectives on conceptsof genetics and disease. Am. J. Psychiatry 167, 899–914. 10.1176/appi.ajp.2009.09071016 - DOI - PMC - PubMed
    1. Boog G. (2004). Obstetrical complications and subsequent schizophrenia in adolescent and young adult offsprings: is there a relationship? Eur. J. Obstet. Gynecol. Reprod. Biol. 114, 130–136. 10.1016/j.ejogrb.2003.09.041 - DOI - PubMed
    1. Boyum A. (1968). Separation of leukocytes from blood and bone marrow. Scandinavian J. Clin. Lab. Invest. 21, 90–109. - PubMed
    1. Buoli M., Bertino V., Caldiroli A., Dobrea C., Serati M., Ciappolino V., et al. (2016). Are obstetrical complications really involved in the etiology and course of schizophrenia and mood disorders? Psychiatry Res. 241, 297–301. 10.1016/j.psychres.2016.05.014 - DOI - PubMed