Meta-Analysis
. 2019 Dec;127(12):126002.
doi: 10.1289/EHP4595. Epub 2019 Dec 18.

Air Pollution (Particulate Matter) Exposure and Associations with Depression, Anxiety, Bipolar, Psychosis and Suicide Risk: A Systematic Review and Meta-Analysis

Affiliations
Meta-Analysis

Air Pollution (Particulate Matter) Exposure and Associations with Depression, Anxiety, Bipolar, Psychosis and Suicide Risk: A Systematic Review and Meta-Analysis

Isobel Braithwaite et al. Environ Health Perspect. 2019 Dec.

Abstract

Background: Particulate air pollution's physical health effects are well known, but associations between particulate matter (PM) exposure and mental illness have not yet been established. However, there is increasing interest in emerging evidence supporting a possible etiological link.

Objectives: This systematic review aims to provide a comprehensive overview and synthesis of the epidemiological literature to date by investigating quantitative associations between PM and multiple adverse mental health outcomes (depression, anxiety, bipolar disorder, psychosis, or suicide).

Methods: We undertook a systematic review and meta-analysis. We searched Medline, PsycINFO, and EMBASE from January 1974 to September 2017 for English-language human observational studies reporting quantitative associations between exposure to PM <1.0μm in aerodynamic diameter (ultrafine particles) and PM <2.5 and <10μm in aerodynamic diameter (PM2.5 and PM10, respectively) and the above psychiatric outcomes. We extracted data, appraised study quality using a published quality assessment tool, summarized methodological approaches, and conducted meta-analyses where appropriate.

Results: Of 1,826 citations identified, 22 met our overall inclusion criteria, and we included 9 in our primary meta-analyses. In our meta-analysis of associations between long-term (>6 months) PM2.5 exposure and depression (n=5 studies), the pooled odds ratio was 1.102 per 10-μg/m3 PM2.5 increase (95% CI: 1.023, 1.189; I2=0.00%). Two of the included studies investigating associations between long-term PM2.5 exposure and anxiety also reported statistically significant positive associations, and we found a statistically significant association between short-term PM10 exposure and suicide in meta-analysis at a 0-2 d cumulative exposure lag.

Discussion: Our findings support the hypothesis of an association between long-term PM2.5 exposure and depression, as well as supporting hypotheses of possible associations between long-term PM2.5 exposure and anxiety and between short-term PM10 exposure and suicide. The limited literature and methodological challenges in this field, including heterogeneous outcome definitions, exposure assessment, and residual confounding, suggest further high-quality studies are warranted to investigate potentially causal associations between air pollution and poor mental health. https://doi.org/10.1289/EHP4595.


Figures
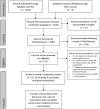
A flowchart for records identified through database searches (n equals 1,826) and additional records identified through other sources (n equals 3).
Figure 1.
Study selection diagram (studies published between 1 January 1974 and 20 September 2017).
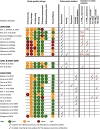
Figure 2 is a tabular representation with authors and years listed in the first column. The ratings, namely, good, fair, weak, and not applicable, are marked in the column study quality ratings; whether outcomes are studied and whether included in meta-analysis are marked in the other columns.
Figure 2.
Summary of results of quality assessment of studies of particulate air pollution and adult mental health outcomes considered eligible for inclusion in this review, outcomes assessed, and overview of inclusion in meta-analyses. Quality was assessed using the Effective Public Health Practice Project (EPHPP) Quality Assessment Tool for Quantitative Studies (MERST 2010; Armijo-Olivo et al. 2012; Thomas et al. 2004), which was developed for evaluating public health research across heterogeneous study designs. We extended the list of study designs assigned a fair rating beyond those listed in the EPHPP Tool Dictionary. We rated all time-series analyses, case-crossover, and hierarchical cluster analyses as fair quality, provided case-crossover studies used bidirectional referent period selection. We rated all cross-sectional studies of associations with long-term PM exposure that used measured or modeled PM values from a period prior to (and not overlapping with) outcome assessment as fair to reflect the relative strength of these studies compared with typical cross-sectional studies with simultaneous exposure and outcome assessment; we rated those using an exposure period overlapping with or after outcome assessment as poor for study quality. We assigned overall ratings according to the EPHPP guidance (those with one poor rating were assigned an overall rating of fair; those with two or more, an overall rating of poor). See Table S3 for further information on the allocation of quality ratings for individual quality components. In the middle set of columns, the outcomes studied (indicated via tick marks) refer to any outcome related to the specified mental health outcome or diagnosis, such as physician diagnosis, meeting a specified threshold on a diagnostic scale, measures of symptom severity, hospital or ED attendance, and in the case of suicide, suicide attempts, ideation, or suicide death. Inclusion in primary meta-analyses (Figures 3, 5, and and funnel plots in Figure 4) is indicated via tick marks in the right-hand set of columns; the numbers and letters of the sensitivity meta-analyses indicated via an S correspond to those detailed in Table 4. Note: ED, emergency department; L-T, long term (6  months) PM exposure (exposure assessment period 6  months); N/A, not applicable; PM, particulate matter; PM10, particulate matter of <10μm in aerodynamic diameter; PM2.5, particulate matter of <2.5μm in aerodynamic diameter; S-T, short term (<6  months) PM exposure (exposure assessment period <6  months).
Figure 3 is a forest plot showing O R 95 percent C I and percentage weight used in a meta-analysis of the following citations: Lin et al. 2017a; Zijlema et al. 2016A,B, and D; Pun et al. 2017, and overall.
Figure 3.
Forest plot of meta-analysis of associations between long-term (6- months) PM2.5 exposure and depression risk (n=5 studies). Results of meta-analysis are shown as pooled effect estimates of the OR of depression per 10μg/m3 (95% CIs). The dashed vertical line indicates the overall effect estimate derived from DerSimonian-Laird random effects meta-analysis (DerSimonian and Laird 1986), and the blue diamond indicates the 95% CI of the overall (pooled) effect estimate. The horizontal lines indicate the 95% CI around each study’s central estimate for the adjusted OR (shown with a closed circle); arrowheads at the end of these lines indicate where the true location of the end of a line is not shown (for scale reasons) and the upper or lower 95% CI is farther from the central estimate, in the direction of the arrowhead. The percentage weights are weightings assigned to individual studies’ results in the DerSimonian-Laird random effects meta-analysis, and the sizes of the shaded squares around each effect estimate are scaled according to these relative weightings. The p-value of 0.972 shown at the bottom left is derived from a test of the null hypothesis of heterogeneity (Cochran’s Q). Covariates adjusted for are detailed in Table S2. Note: CI, confidence interval; OR, odds ratio; PM2.5, particulate matter of <2.5μm in aerodynamic diameter.
Figure 4A is a funnel plot for depression with long-term PM subscript 2.5 exposure, plotting standard error of natural logarithm of the odds ratio (y-axis) across natural logarithm of the odds ratio (x-axis). Figure 4B plots the same for a long-term PM subscript 10 exposure. Figure 4C is a funnel plot for suicide risk with a short-term PM subscript 10 exposure, lag equals 01 days, plotting standard error of natural logarithm of the rate ratio (y-axis) across natural logarithm of the rate ratio (x-axis). Figure 4D plots the same for a lag equals 02 days.
Figure 4.
Funnel plots for all primary meta-analyses. Primary meta-analysis of depression with long-term (A) PM2.5 and (B) PM10 exposure. Meta-analysis of suicide risk with short-term PM10 exposure, (C) lag= 0-1 d and (D) lag  = 0-2 d. A summary of the studies included in each funnel plot is shown in Figure 2; those indicated by tick marks in the right-hand column are included in primary meta-analyses. Funnel plots for sensitivity meta-analyses, the results of which are detailed in Table 4, are not included in this figure. The dark blue circles represent the central estimates for each included study or substudy’s results; the dashed diagonal lines represent pseudo 95% confidence intervals and the solid vertical lines represent the natural logarithm of the overall effect estimate. Note: L-T, long-term (6  months) PM exposure (exposure assessment period 6  months); lnOR, natural logarithm of the odds ratio; lnRR, natural logarithm of the relative risk (both presented per 10μg/m3 increase in PM10 or PM2.5 exposure); SE, standard error; S-T, short-term (<6  months) PM exposure (exposure assessment period <6  months).
Figure 5 is a forest plot showing O R 95 percent C I and percentage weight used in a meta-analysis of the following citations: Zijlema et al. 2016A, B, and D, and overall.
Figure 5.
Forest plot of meta-analysis of associations between long-term (6- months) PM10 exposure and depression risk (n=3 studies). Results of meta-analysis are shown as pooled effect estimates of the OR of depression per 10μg/m3 (95% CIs). The dashed vertical line indicates the overall effect estimate derived from DerSimonian-Laird random effects meta-analysis, and the blue diamond indicates the 95% CI of the overall (pooled) effect estimate. The horizontal lines indicate the 95% CI around each study’s central estimate for the adjusted OR (shown with a closed circle); the arrowhead at the end of the line for Zijlema et al. 2016, Substudy A (LifeLines) indicates that the true end of this line is not shown (for scale reasons) and the lower 95% CI is farther from the central estimate. The percentage weights are weightings assigned to individual studies’ results in the DerSimonian-Laird random effects meta-analysis, and the sizes of the shaded squares around each effect estimate are scaled according to these relative weightings. The p-value of 0.638 shown at the bottom left is derived from a test of the null hypothesis of heterogeneity (Cochran’s Q). Covariates adjusted for by individual studies are detailed in Table S2. Note: CI, confidence interval; OR, odds ratio; PM10, particulate matter of <10μm in aerodynamic diameter.
Figure 6 is a forest plot showing relative risk and percentage weights used in meta-analyses of the following study citations. At the top is a forest plot of the results at lag 01 days of Bakian et al. 2015, Casas et al. 2017, Lin et al. 2016, and below this is a forest plot of the results at lag 02 days of Bakian et al. 2015, Casas et al. 2017, Kim et al. 2010 and Lin et al. 2016.
Figure 6.
Forest plot of meta-analyses of associations between short-term PM10 exposure and risk of completed suicide (relative risk per 10μg/m3), at cumulative lags 0-1 and 0-2 d. Results of meta-analysis are shown as pooled effect estimates for RR of depression per 10μg/m3 PM10 (95% CIs). Lag 0-1 refers to the cumulatively lagged values (moving average) of concentrations across Day 0 (the day of the outcome event) and Day 1 (the previous day), whereas Lag 0-2 refers to the cumulative lagged values across Days 0, 1, and 2. The dashed lines indicate the overall effect estimates, separately for each cumulative lag, derived from DerSimonian-Laird random effects meta-analysis, and the diamond indicates the 95% CI of the overall (pooled) effect estimate. The horizontal lines indicate the 95% CI around each study’s central estimate for the adjusted RR at this exposure time lag (shown with a closed circle); the arrowhead at the right end of the line for Bakian et al. (2015) at lag 0-2 d indicates that the true location of the upper 95% CI for this study is farther from the central estimate. The percentage weights are weightings of the individual studies in the DerSimonian-Laird random effects meta-analysis, and the sizes of the shaded squares around each effect estimate are scaled according to these relative weightings. The p-values at the bottom left are from a test of the null hypothesis of heterogeneity (Cochran’s Q). The covariates that each study adjusted for are detailed in Table S2. Note: CI, confidence interval; PM10, particulate matter of <10μm in aerodynamic diameter; RR, relative risk.

Comment in

References

    1. Afshari R. 2017. Reported association of air pollution and suicide rate could be confounded. Environ Health 16(1):16, PMID: 28245827, 10.1186/s12940-017-0219-3. - DOI - PMC - PubMed
    1. Allen JL, Liu X, Pelkowski S, Palmer B, Conrad K, Oberdörster G, et al. . 2014. Early postnatal exposure to ultrafine particulate matter air pollution: persistent ventriculomegaly, neurochemical disruption, and glial activation preferentially in male mice. Environ Health Perspect 122(9):939–945, PMID: 24901756, 10.1289/ehp.1307984. - DOI - PMC - PubMed
    1. Allen RW, Davies H, Cohen MA, Mallach G, Kaufman JD, Adar SD. 2009. The spatial relationship between traffic-generated air pollution and noise in 2 US cities. Environ Res 109(3):334–342, PMID: 19193368, 10.1016/j.envres.2008.12.006. - DOI - PMC - PubMed
    1. Armijo-Olivo S, Stiles CR, Hagen NA, Biondo PD, Cummings GG. 2012. Assessment of study quality for systematic reviews: a comparison of the Cochrane Collaboration Risk of Bias Tool and the Effective Public Health Practice Project Quality Assessment Tool: methodological research. J Eval Clin Pract 18(1):12–18, PMID: 20698919, 10.1111/j.1365-2753.2010.01516.x. - DOI - PubMed
    1. Attademo L, Bernardini F, Garinella R, Compton MT. 2017. Environmental pollution and risk of psychotic disorders: a review of the science to date. Schizophr Res 181:55–59, PMID: 27720315, 10.1016/j.schres.2016.10.003. - DOI - PubMed

Publication types

MeSH terms