

Association of Prenatal and Perinatal Exposures to Particulate Matter With Changes in Hemoglobin A1c Levels in Children Aged 4 to 6 Years
- PMID: 31851346
- PMCID: PMC6991256
- DOI: 10.1001/jamanetworkopen.2019.17643
Association of Prenatal and Perinatal Exposures to Particulate Matter With Changes in Hemoglobin A1c Levels in Children Aged 4 to 6 Years
Abstract
Importance: Environmental risk factors for childhood type 2 diabetes, an increasing global problem, are understudied. Air pollution exposure has been reported to be a risk factor for this condition.
Objective: To examine the association between prenatal and perinatal exposures to fine particulate matter with a diameter less than 2.5 μm (PM2.5) and changes in hemoglobin A1c (HbA1c), a measure of glycated hemoglobin and marker of glucose dysregulation, in children aged 4 to 7 years.
Design, setting, and participants: The Programming Research in Obesity, Growth, Environment, and Social Stressors (PROGRESS) study, a birth cohort study conducted in Mexico City, Mexico, recruited pregnant women from July 3, 2007, to February 21, 2011, through public health maternity clinics. The present analysis includes 365 mother-child pairs followed up until the child was approximately 7 years of age. This study included data from only study visits at approximately 4 to 5 years (visit 1) and 6 to 7 years (visit 2) post partum because HbA1c levels were not measured in earlier visits. The data were analyzed from March 11, 2018, to May 3, 2019.
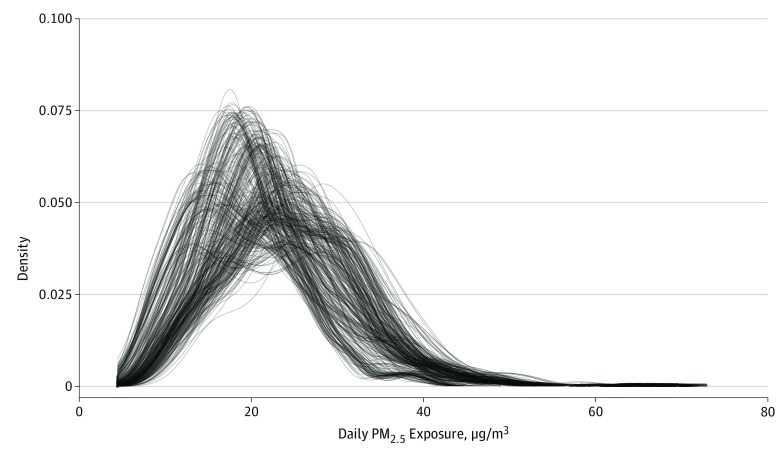
Exposures: Daily PM2.5 exposure estimates at participants' home addresses from 4 weeks prior to mothers' date of last menstrual period (LMP), a marker of the beginning of pregnancy, to 12 weeks after the due date. Exposure was estimated from satellite measurements and calibrated against ground PM2.5 measurements, land use, and meteorological variables.
Main outcomes and measures: Outcomes included HbA1c levels at 4 to 5 years and 6 to 7 years of age, and the change in the level from the former age group to the latter.
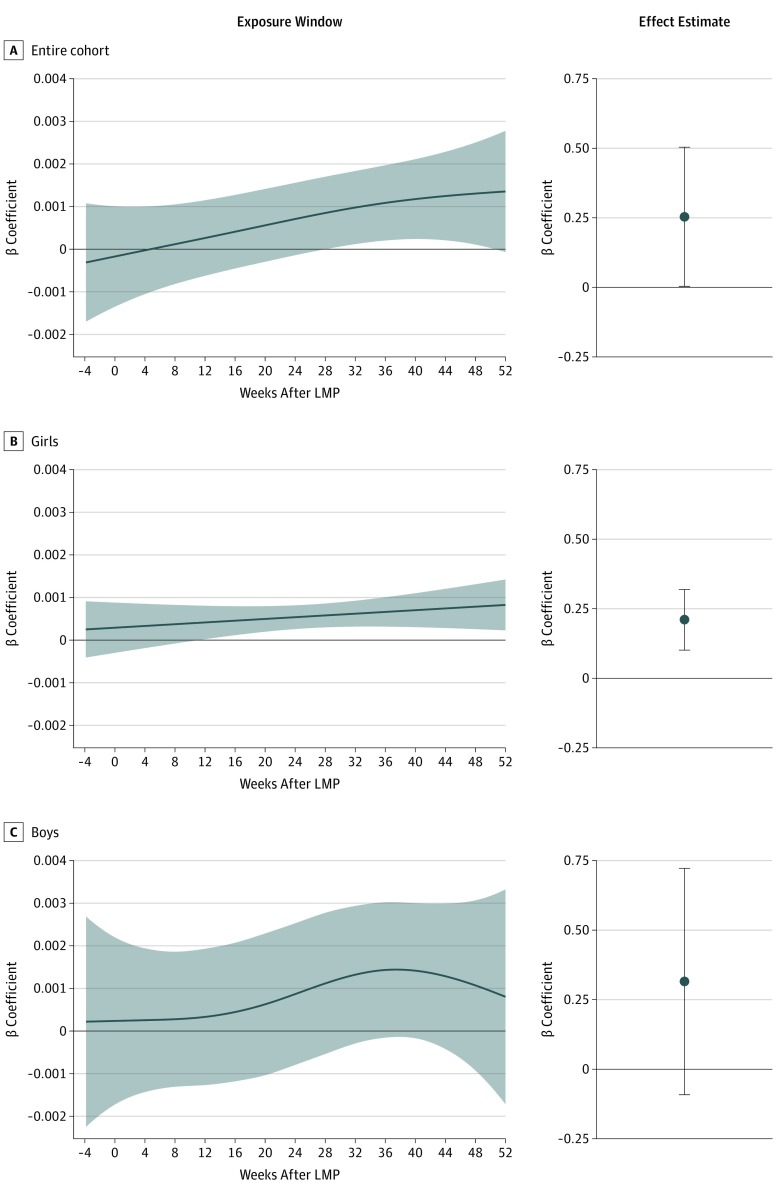
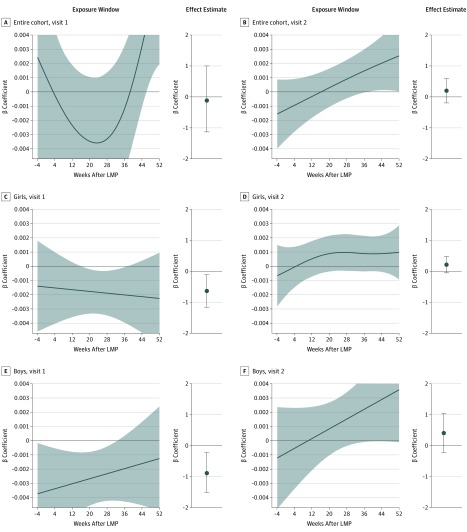
Results: The sample included 365 children, of whom 184 (50.4%) were girls. The mean (range) age of the children was 4.8 (4.0-6.4) years at visit 1, and 6.7 (6.0-9.7) years at visit 2. At the time of delivery, the mean (range) age of the mothers was 27.7 (18.3-44.4) years, with a mean (range) prepregnancy body mass index of 26.4 (18.5-43.5). The mean (SD) prenatal PM2.5 exposure (22.4 μg/m3 [2.7 μg/m3]) was associated with an annual increase in HbA1c levels of 0.25% (95% CI, 0.004%-0.50%) from age 4 to 5 years to 6 to 7 years compared with exposure at 12 μg/m3, the national regulatory standard in Mexico. Sex-specific effect estimates were statistically significant for girls (β = 0.21%; 95% CI, 0.10% to 0.32%) but not for boys (β = 0.31%; 95% CI, -0.09% to 0.72%). The statistically significant windows of exposure were from week 28 to 50.6 after the mother's LMP for the overall cohort and from week 11 to the end of the study period for girls. Lower HbA1c levels were observed at age 4 to 5 years in girls (β = -0.72%; 95% CI, -1.31% to -0.13%, exposure window from week 16 to 37.3) and boys (β = -0.98%; 95% CI, -1.70% to -0.26%, exposure window from the beginning of the study period to week 32.7), but no significant association was found in the overall cohort (β = -0.13%; 95% CI, -1.27% to 1.01%). There was no significant association between PM2.5 exposure and HbA1c level at age 6 to 7 years in any group.
Conclusions and relevance: The findings of this study suggest that prenatal and perinatal exposures to PM2.5 are associated with changes in HbA1c, which are indicative of glucose dysregulation, in early childhood. Further research is needed because this finding may represent a risk factor for childhood or adolescent diabetes.
Conflict of interest statement
Figures
Similar articles
-
Association of Prenatal Exposure to Air Pollution With Autism Spectrum Disorder.JAMA Pediatr. 2019 Jan 1;173(1):86-92. doi: 10.1001/jamapediatrics.2018.3101. JAMA Pediatr. 2019. PMID: 30452514 Free PMC article.
-
Identifying critical windows of prenatal particulate matter (PM2.5) exposure and early childhood blood pressure.Environ Res. 2020 Mar;182:109073. doi: 10.1016/j.envres.2019.109073. Epub 2019 Dec 23. Environ Res. 2020. PMID: 31881529 Free PMC article.
-
Prenatal and early life exposure to particulate matter, environmental tobacco smoke and respiratory symptoms in Mexican children.Environ Res. 2021 Jan;192:110365. doi: 10.1016/j.envres.2020.110365. Epub 2020 Oct 22. Environ Res. 2021. PMID: 33223137 Free PMC article.
-
The impact of air pollution to obesity.Neuro Endocrinol Lett. 2020 Sep;41(3):146-153. Neuro Endocrinol Lett. 2020. PMID: 33201649 Review.
-
Association between ambient particulate matter exposure and mitochondrial DNA copy number: A systematic review and meta-analysis.Sci Total Environ. 2024 May 1;923:171423. doi: 10.1016/j.scitotenv.2024.171423. Epub 2024 Mar 4. Sci Total Environ. 2024. PMID: 38442762
Cited by
-
Traffic-related air pollution, biomarkers of metabolic dysfunction, oxidative stress, and CC16 in children.J Expo Sci Environ Epidemiol. 2022 Jul;32(4):530-537. doi: 10.1038/s41370-021-00378-6. Epub 2021 Aug 20. J Expo Sci Environ Epidemiol. 2022. PMID: 34417545 Free PMC article.
-
Oxidative stress and pediatric diabetic cardiovascular complications: emerging research and clinical applications.Am J Physiol Heart Circ Physiol. 2025 Apr 1;328(4):H945-H962. doi: 10.1152/ajpheart.00673.2024. Epub 2025 Feb 28. Am J Physiol Heart Circ Physiol. 2025. PMID: 40019178 Free PMC article. Review.
-
Hemoglobin as a mediator between air pollution and growth outcomes in children under 60 months: the moderating role of nutritional supplementation.BMC Public Health. 2025 Mar 28;25(1):1187. doi: 10.1186/s12889-025-22381-4. BMC Public Health. 2025. PMID: 40155842 Free PMC article.
-
Cardiovascular adaptations to particle inhalation exposure: molecular mechanisms of the toxicology.Am J Physiol Heart Circ Physiol. 2020 Aug 1;319(2):H282-H305. doi: 10.1152/ajpheart.00026.2020. Epub 2020 Jun 19. Am J Physiol Heart Circ Physiol. 2020. PMID: 32559138 Free PMC article. Review.
-
Integrated RNA Sequencing Reveals Epigenetic Impacts of Diesel Particulate Matter Exposure in Human Cerebral Organoids.Dev Neurosci. 2020;42(5-6):195-207. doi: 10.1159/000513536. Epub 2021 Mar 3. Dev Neurosci. 2020. PMID: 33657557 Free PMC article.
References
-
- Dabelea D, Stafford JM, Mayer-Davis EJ, et al. ; SEARCH for Diabetes in Youth Research Group . Association of type 1 diabetes vs type 2 diabetes diagnosed during childhood and adolescence with complications during teenage years and young adulthood. JAMA. 2017;317(8):825-835. doi:10.1001/jama.2017.0686 - DOI - PMC - PubMed
Publication types
MeSH terms
Substances
Grants and funding
LinkOut - more resources
Full Text Sources
Medical
