. 2019 Dec 18;14(12):e0226302.
doi: 10.1371/journal.pone.0226302. eCollection 2019.

Isolation of endothelial cells, pericytes and astrocytes from mouse brain

Affiliations

Isolation of endothelial cells, pericytes and astrocytes from mouse brain

Florian Bernard-Patrzynski et al. PLoS One. .

Abstract

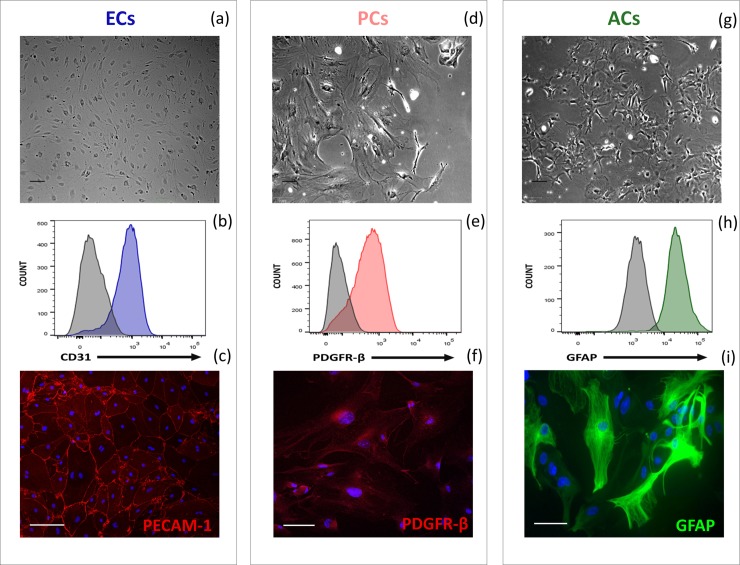
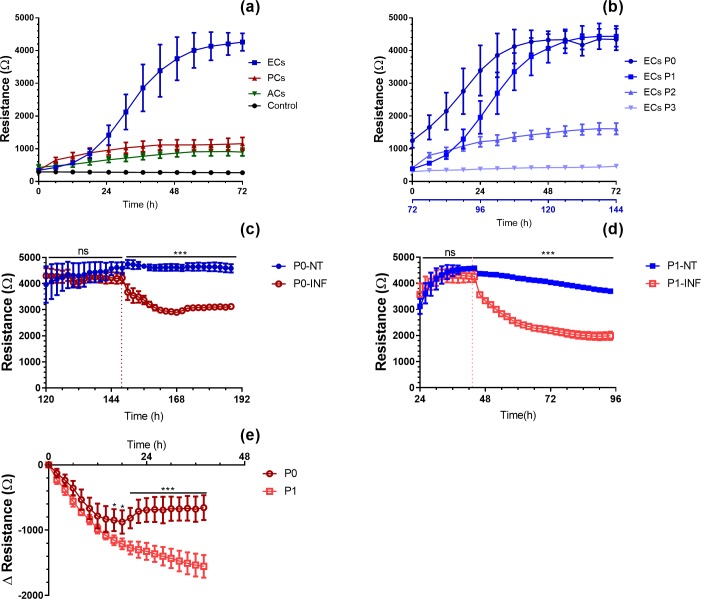
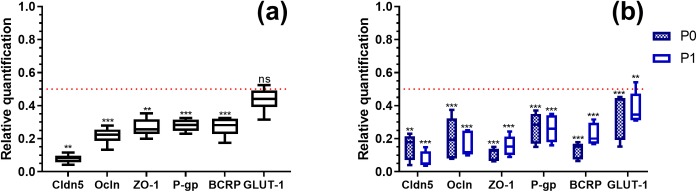
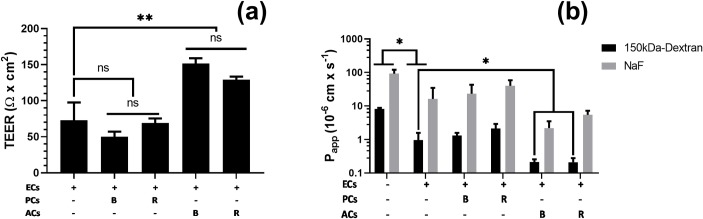
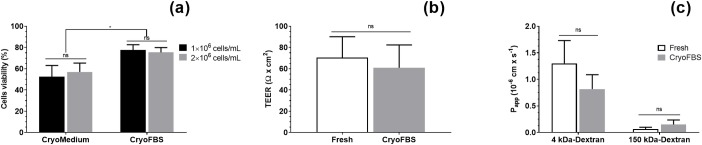
Primary cell isolation from the central nervous system (CNS) has allowed fundamental understanding of blood-brain barrier (BBB) properties. However, poorly described isolation techniques or suboptimal cellular purity has been a weak point of some published scientific articles. Here, we describe in detail how to isolate and enrich, using a common approach, endothelial cells (ECs) from adult mouse brains, as well as pericytes (PCs) and astrocytes (ACs) from newborn mouse brains. Our approach allowed the isolation of these three brain cell types with purities of around 90%. Furthermore, using our protocols, around 3 times more PCs and 2 times more ACs could be grown in culture, as compared to previously published protocols. The cells were identified and characterized using flow cytometry and confocal microscopy. The ability of ECs to form a tight monolayer was assessed for passages 0 to 3. The expression of claudin-5, occludin, zonula occludens-1, P-glycoprotein-1 and breast cancer resistance protein by ECs, as well as the ability of the cells to respond to cytokine stimuli (TNF-α, IFN-γ) was also investigated by q-PCR. The transcellular permeability of ECs was evaluated in the presence of pericytes or astrocytes in a Transwell® model by measuring the transendothelial electrical resistance (TEER), dextran-FITC and sodium fluorescein permeability. Overall, ECs at passages 0 and 1 featured the best properties valued in a BBB model. Furthermore, pericytes did not increase tightness of EC monolayers, whereas astrocytes did regardless of their seeding location. Finally, ECs resuspended in fetal bovine serum (FBS) and dimethyl sulfoxide (DMSO) could be cryopreserved in liquid nitrogen without affecting their phenotype nor their capacity to form a tight monolayer, thus allowing these primary cells to be used for various longitudinal in vitro studies of the blood-brain barrier.


Conflict of interest statement

The authors have declared that no competing interests exist.

Figures

Fig 1
Fig 1. Identification of isolated brain cells from mice.
(a, b, c) Endothelial cells (ECs) at P1; (d, e, f) Pericytes (PCs) at P3; (g, h, i) Astrocytes (ACs) at P1. (a, d, g) Differential interference contrast (DIC) images (× 20) of the above-mentioned cell types. (b, c) Platelet endothelial cell adhesion molecule 1 (PECAM1, CD31), (e, f) beta-type platelet-derived growth factor receptor (PDGFR-β) and (h, i) glial fibrillary acidic protein (GFAP) protein expression as assessed by (b, e, h) flow cytometry and (c, f, i) immunofluorescence confocal microscopy (× 40). Representative of n = 5. (b, e, h) Mean fluorescence intensity plots (control isotype in grey) are shown. (c, f, i) Nuclei were stained with DAPI (blue). Scale bars represent 100 μm.
Fig 2
Fig 2. Electrical resistance of primary cultures of pericytes, astrocytes and endothelial cells, as measured by ECIS Zθ.
(a) Transcellular electrical resistance comparison between pericytes (PCs), astrocytes (ACs) and endothelial cells (ECs) at passage 1 (n = 4). (b) Transendothelial electrical resistance measured from P0 to P3. The second x-axis in (b) is used to compare ECs (P0) to the other passages at similar resistance values (n = 4). (c, d) Transcellular electrical resistances of confluent monolayers of ECs at (c) passage 0 (P0) or (d) passage 1 (P1) either inflamed with 100 U/ml of TNF-α and IFN-γ (INF) or non-treated (NT) (P0: n = 5, P1: n = 4). The vertical dotted lines denote the addition of the pro-inflammatory cytokines. (e) Transcellular electrical resistance comparison of P0 and P1 ECs treated with TNF-α and IFN-γ (normalized at the treatment time point). Two-way ANOVA; * P-value ≤ 0.05, ** P-value ≤ 0.01, *** P-value ≤ 0.001. Each point represents the mean resistance measured every 6 hours (a, b) or 2 hours (c, d, e) ± standard deviations.
Fig 3
Fig 3. Relative quantification of the mRNA of junction and transporter proteins in primary endothelial cells.
Analysis of the mRNA expression of (a) junction proteins: claudin-5 (Cldn5), occludin (Ocln), zonula occludens-1 (Tjp1; ZO-1) and transporter proteins: P-glycoprotein-1 (P-gp), breast cancer resistance protein (Bcrp; ABCG2) and glucose transporter-1 (Glut-1; SLC2A1) in endothelial cells at passage 1 (P1) assessed by q-PCR. The results are represented as relative values to P0. (b) The relative mRNA expression levels of junction and transporter proteins in P0 and P1 ECs, inflamed with 100 U/mL of TNF-α and IFN-γ for 24h. The results are relative to the corresponding untreated EC passages. All results were first normalized with Hprt/Gapdh/Tbp mRNA levels. The results are represented as the means ± standard deviations of 6 replicates. The dotted red lines represent a fold change of 0.5, underneath which, values were considered biologically significantly changed. Stars show significative differences between tested conditions and their corresponding base values. t-test: * P-value ≤ 0.05, ** P-value ≤ 0.01, *** P-value ≤ 0.001.
Fig 4
Fig 4. Measurement of the transcellular permeability of primary endothelial cells alone or in co-culture with pericytes or astrocytes.
(a) Transendothelial electrical resistance values. (b) Permeability values of dextran-FITC (150 kDa, 1 mg/mL) and sodium-fluorescein (376 Da, 100 μg/mL). Data were acquired with primary endothelial cells (ECs) cultured on 24-Transwell® in presence or absence of pericytes (PCs) or astrocytes (ACs). PCs and ACs were either cultured at the bottom of the wells (B) or on the reverse side of the inserts (mimicking the abluminal side) (R). Data represent the mean values ± SD (n ≥ 4). ANOVA with Tukey’s test: ns: non-significant, * P-value < 0.05, ** 0.001 ≤ P-value ≤ 0.01.
Fig 5
Fig 5. Viability of primary endothelial cells after cryopreservation.
(a) Primary endothelial cells (ECs) were concentrated at 1 million cells/mL (black bars) or 2 million cells/mL (grey bars) in either ECs culture medium supplemented with 10% DMSO (CryoMedium) or foetal bovine serum supplemented with 10% DMSO (CryoFBS). Cells were counted after Trypan blue staining, prior to cryopreservation and after thawing. Results are presented as the percentage of the total number of living cells after thawing on the total number of living cells prior to cryopreservation. Data represent the mean values ± SD (n = 4). ANOVA with Tukey’s test: ns: non-significant, * P-value < 0.05. (b) Transendothelial electrical resistance (TEER) of non-cryopreserved P1 ECs (Fresh, white bar) and P1 ECs post-cryopreservation (CryoFBS, grey bar) 9 days after seeding. Data represent the mean values ± SD (n = 8). (c) Permeability values of 4 kDa and 150 kDa FITC-conjugated dextrans through non-cryopreserved P1 ECs (Fresh, white bar) and P1 ECs post-cryopreservation (CryoFBS, grey bar) 9 days after seeding. Data represent the mean values ± SD (n = 4). T-test: ns: non-significant (P-value > 0.05).

References

    1. Banerjee J, Shi Y, Azevedo HS. In vitro blood–brain barrier models for drug research: state-of-the-art and new perspectives on reconstituting these models on artificial basement membrane platforms. Drug Discovery Today. 2016;21(9):1367–86. 10.1016/j.drudis.2016.05.020 - DOI - PubMed
    1. Stamatovic SM, Johnson AM, Keep RF, Andjelkovic AV. Junctional proteins of the blood-brain barrier: New insights into function and dysfunction. Tissue Barriers. 2016;4(1):e1154641 10.1080/21688370.2016.1154641 PMC4836471. - DOI - PMC - PubMed
    1. Engelhardt B, Sorokin L. The blood-brain and the blood-cerebrospinal fluid barriers: function and dysfunction. Semin Immunopathol. 2009;31(4):497–511. 10.1007/s00281-009-0177-0 - DOI - PubMed
    1. Lécuyer M-A, Kebir H, Prat A. Glial influences on BBB functions and molecular players in immune cell trafficking. Biochimica et Biophysica Acta (BBA)—Molecular Basis of Disease. 2016;1862(3):472–82. 10.1016/j.bbadis.2015.10.004 - DOI - PubMed
    1. Pardridge WM. The blood-brain barrier: Bottleneck in brain drug development. NeuroRX. 2005;2(1):3–14. 10.1602/neurorx.2.1.3 - DOI - PMC - PubMed

Publication types

LinkOut - more resources