

Droplet digital PCR assays for the quantification of brown trout (Salmo trutta) and Arctic char (Salvelinus alpinus) from environmental DNA collected in the water of mountain lakes
- PMID: 31851707
- PMCID: PMC6919618
- DOI: 10.1371/journal.pone.0226638
Droplet digital PCR assays for the quantification of brown trout (Salmo trutta) and Arctic char (Salvelinus alpinus) from environmental DNA collected in the water of mountain lakes
Abstract
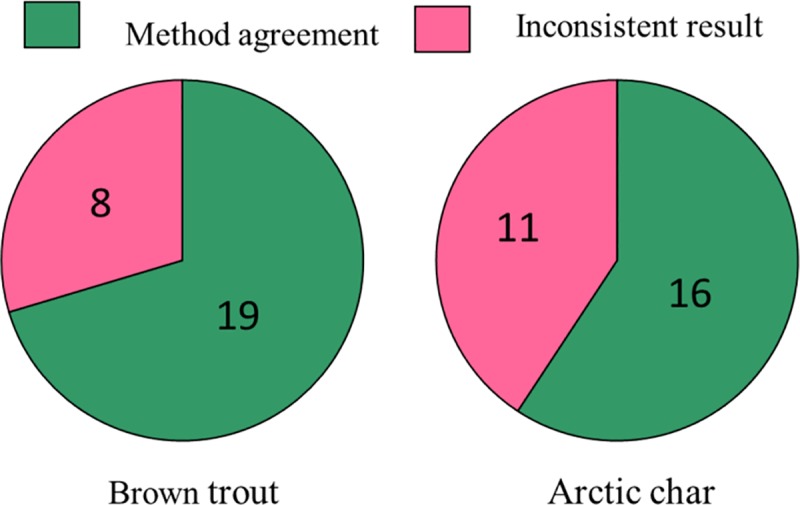
Classical methods for estimating the abundance of fish populations are often both expensive, time-consuming and destructive. Analyses of the environmental DNA (eDNA) present in water samples could alleviate such constraints. Here, we developed protocols to detect and quantify brown trout (Salmo trutta) and Arctic char (Salvelinus alpinus) populations by applying the droplet digital PCR (ddPCR) method to eDNA molecules extracted from water samples collected in 28 Swedish mountain lakes. Overall, contemporary fish CPUE (catch per unit effort) estimates from standardized survey gill nettings were not correlated to eDNA concentrations for either of the species. In addition, the measured environmental variables (e.g. dissolved organic carbon concentrations, temperature, and pH) appear to not influence water eDNA concentrations of the studied fish species. Detection probabilities via eDNA analysis showed moderate success (less than 70% for both species) while the presence of eDNA from Arctic char (in six lakes) and brown trout (in one lake) was also indicated in lakes where the species were not detected with the gillnetting method. Such findings highlight the limits of one or both methods to reliably detect fish species presence in natural systems. Additional analysis showed that the filtration of water samples through 1.2 μm glass fiber filters and 0.45 μm mixed cellulose ester filters was more efficient in recovering DNA than using 0.22 μm enclosed polyethersulfone filters, probably due to differential efficiencies of DNA extraction. Altogether, this work showed the potentials and limits of the approach for the detection and the quantification of fish abundance in natural systems while providing new insights in the application of the ddPCR method applied to environmental DNA.
Conflict of interest statement
The authors have declared that no competing interests exist.
Figures


References
-
- Taberlet P, Bonin A, Zinger L, Coissac E. Environmental DNA: For biodiversity research and monitoring. Oxford Uni. 2018. 10.1093/oso/9780198767220.001.0001 - DOI
Publication types
MeSH terms
Substances
LinkOut - more resources
Full Text Sources
