. 2019 Dec 17;29(12):3902-3915.e8.
doi: 10.1016/j.celrep.2019.11.039.

Topologically Associated Domains Delineate Susceptibility to Somatic Hypermutation

Affiliations

Topologically Associated Domains Delineate Susceptibility to Somatic Hypermutation

Filip Senigl et al. Cell Rep. .

Abstract

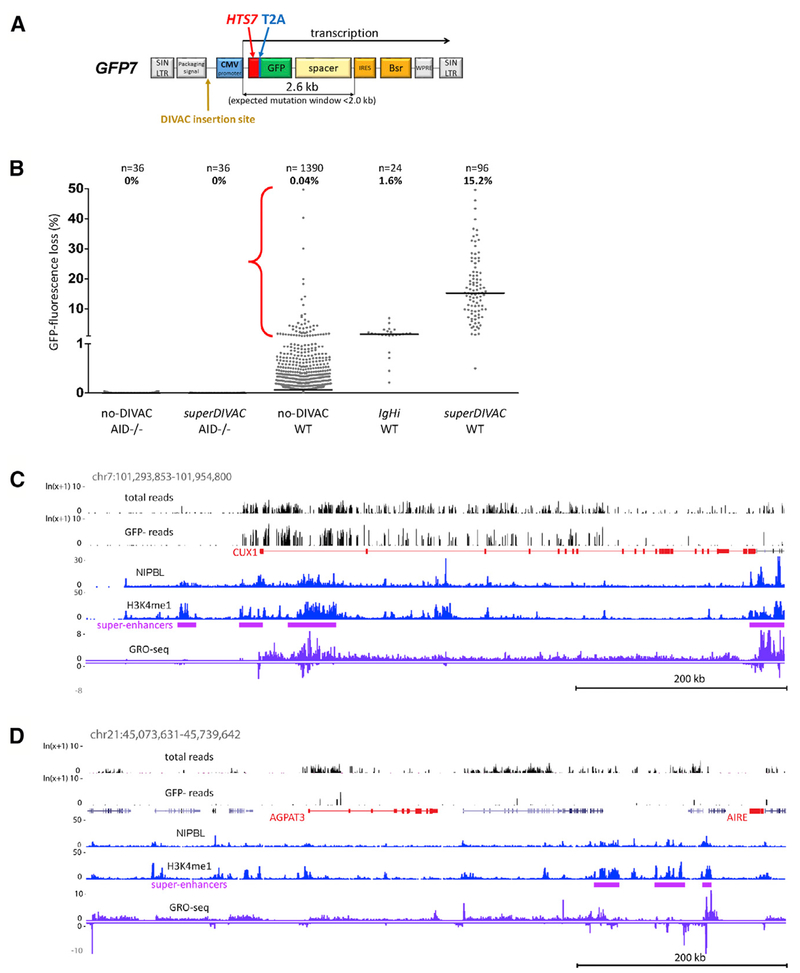
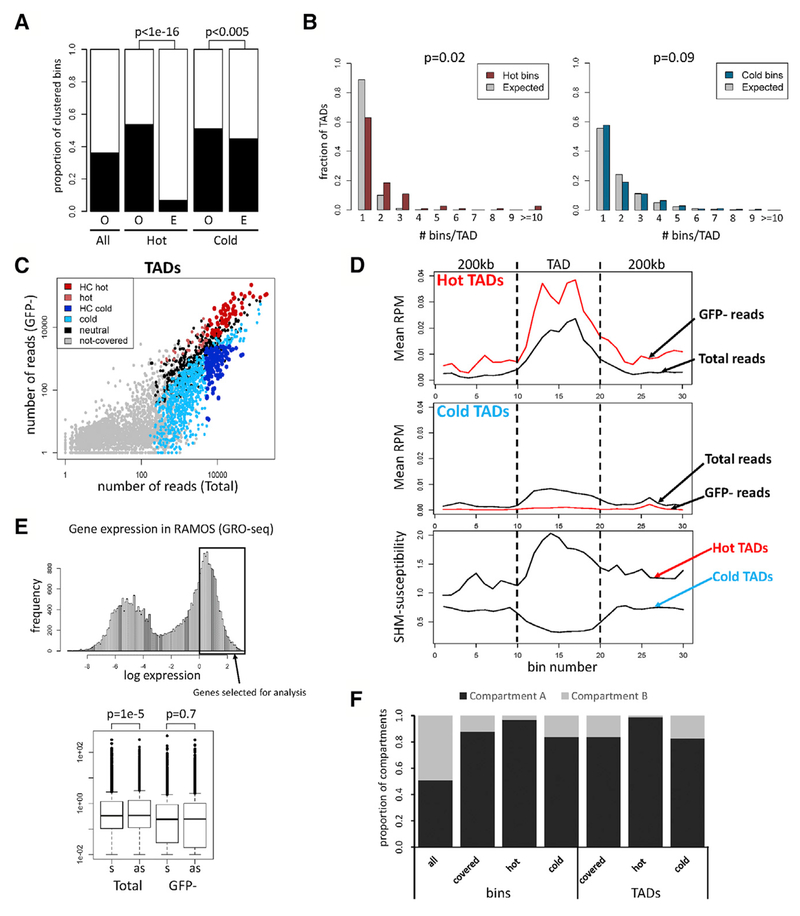
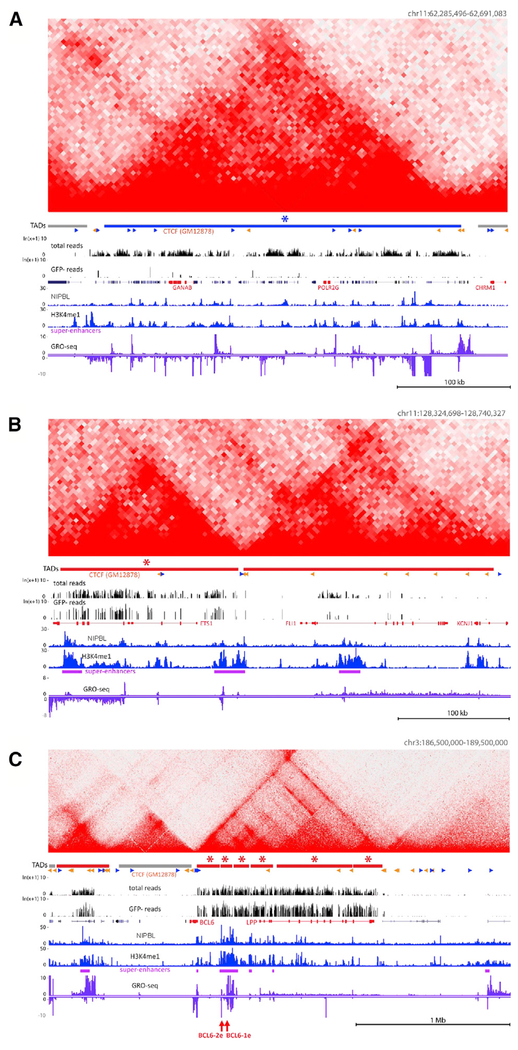
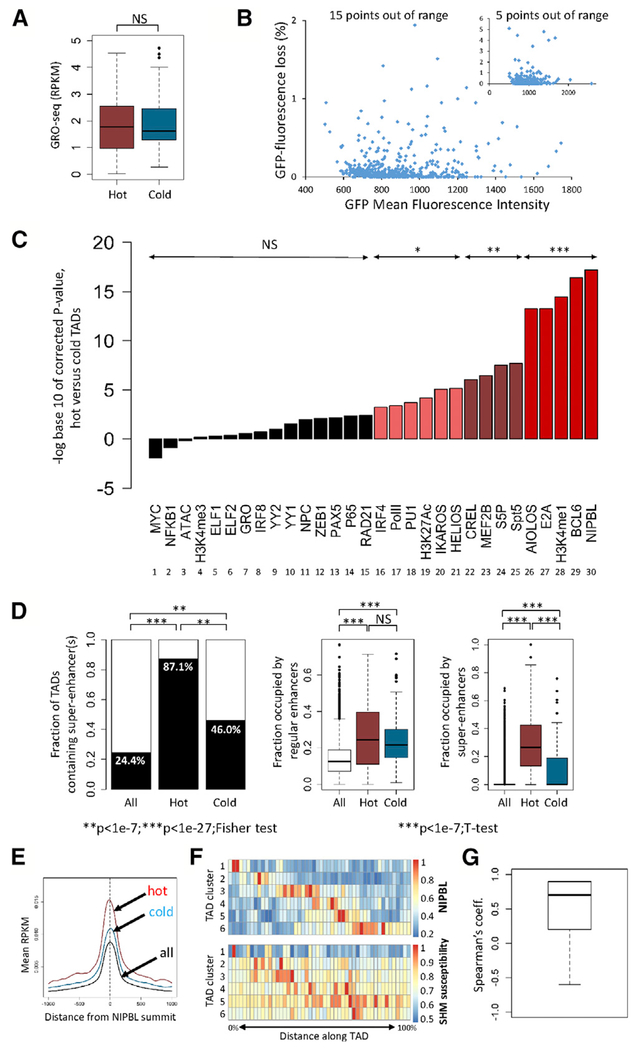
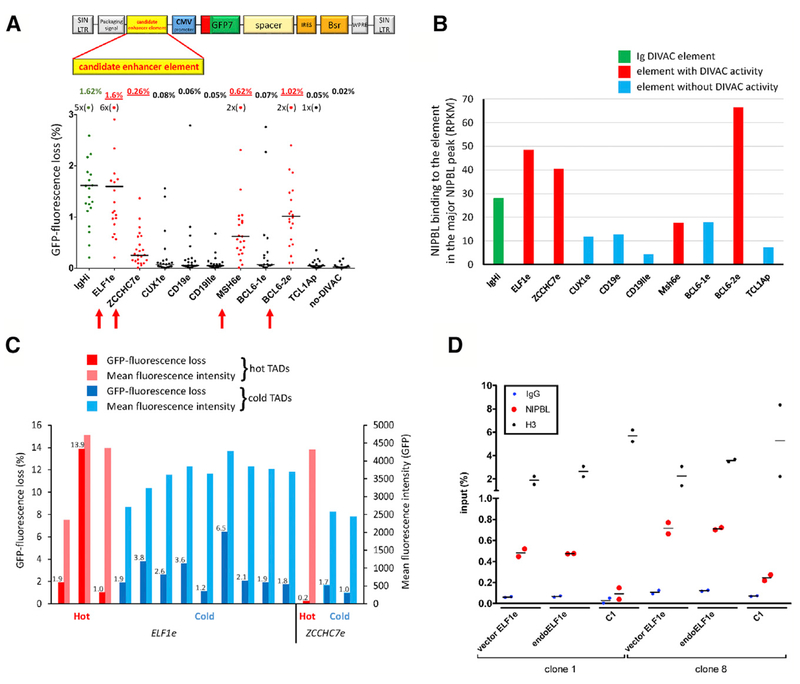
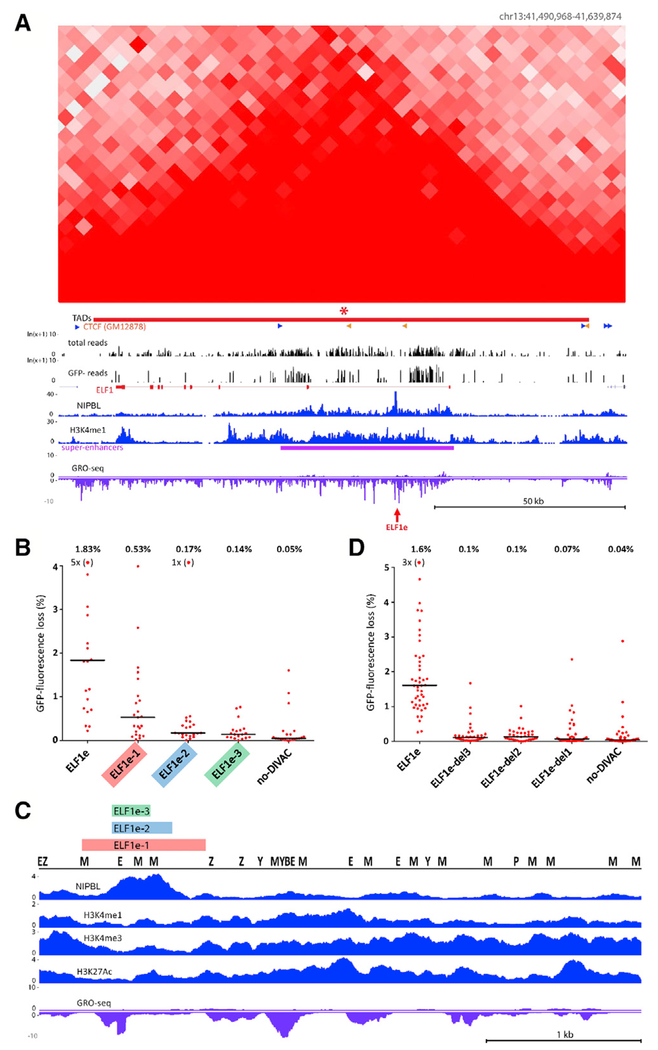
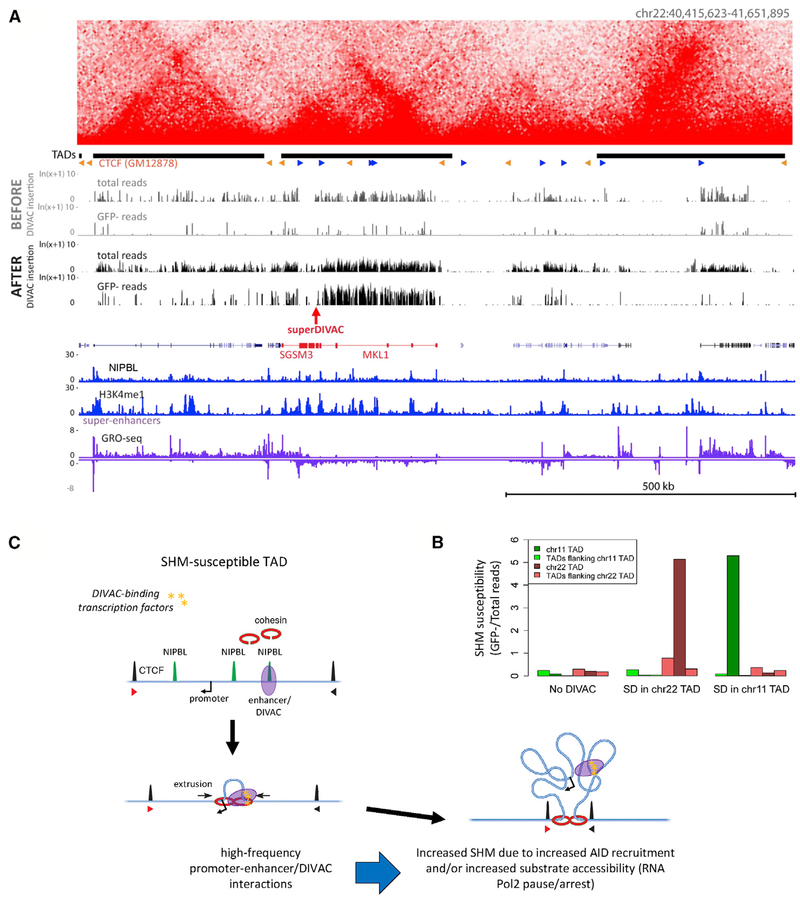
Somatic hypermutation (SHM) introduces point mutations into immunoglobulin (Ig) genes but also causes mutations in other parts of the genome. We have used lentiviral SHM reporter vectors to identify regions of the genome that are susceptible ("hot") and resistant ("cold") to SHM, revealing that SHM susceptibility and resistance are often properties of entire topologically associated domains (TADs). Comparison of hot and cold TADs reveals that while levels of transcription are equivalent, hot TADs are enriched for the cohesin loader NIPBL, super-enhancers, markers of paused/stalled RNA polymerase 2, and multiple important B cell transcription factors. We demonstrate that at least some hot TADs contain enhancers that possess SHM targeting activity and that insertion of a strong Ig SHM-targeting element into a cold TAD renders it hot. Our findings lead to a model for SHM susceptibility involving the cooperative action of cis-acting SHM targeting elements and the dynamic and architectural properties of TADs.

Keywords: activation induced deaminase; chromatin loop extrusion; chromatin structure; somatic hypermutation; topologically associated domain; transcription factor.


Conflict of interest statement

DECLARATION OF INTERESTS

The authors declare no competing interests.

Figures

Figure 1.
Figure 1.. Retroviral-Based Reporter Assay Maps SHM Susceptibility in the B Cell Genome
(A) Map of GFP7 retroviral SHM reporter vector. Bsr, blasticidin resistance; CVM, cytomegalovirus; HTS7, hypermutation target sequence; IRES, internal ribosome entry site; SIN LTR, self-inactivating long terminal repeat; spacer, sequences that place Bsr outside of the SHM target window; T2A, self-cleaving T2A peptide; WPRE, woodchuck heptatitis virus posttranscriptional regulatory element. (B) GFP fluorescence loss (3 weeks of culture) in WT or AID-deficient Ramos clones infected with GFP7 lacking DIVAC or containing superDIVAC or IgHi. Each point is an independent cell clone (number of clones and median of the data indicated above). Bar, data median. Red bracket, no-DIVAC GFP7 WT Ramos clones with substantial GFP loss (>1%); most data points for this sample lie close to the x axis and are not readily visible. (C and D) Examples of DIVAC-trap HTISA data. No-DIVAC GFP7 integration site sequence read tracks for Total and GFP populations (log scale) are shown above tracks for NIPBL, H3K4me1, super-enhancers, and GRO-seq (sense and antisense above and below the line, respectively). SHM-susceptible non-Ig (CUX1 locus, C) and SHM-resistant AGPAT3 locus (D) are shown. AGPAT3 locus data derive from a different experiment (superDIVAC chr22 TAD knockin; same as shown in Figure S3B) due to better genome coverage in that experiment.
Figure 2.
Figure 2.. Regions Susceptible to SHM Correspond to TADs
(A) Clustering of bins. Proportion of bins having at least one adjacent bin of the same category (O, observed) is compared to the proportion expected for random distribution (E, expected). Proportion of covered bins with an adjacent covered bin is also shown (All). Chi-square test was used. (B) Distribution of hot and cold bins in TADs. The distribution of hot (left) or cold (right) bins in TADs containing at least one hot or cold bin, respectively, is plotted next to the expected distribution obtained when hot or cold bins were randomly assigned to those TADs (gray bars). (C) Number of sequence reads from Total and GFP populations in TADs. High-confidence (HC) hot and cold TADs, dark red and blue, respectively; TADs that are hot or cold in some experiments but do not meet HC criteria, light red and light blue, respectively; covered TADs that are neither hot nor cold (neutral), black. (D) Distribution of SHM susceptibility at hot and cold TADs. TADs and 200-kb adjacent regions were divided into 10 bins, and normalized reads per million mapped reads (RPM) is plotted for hot (top) and cold (middle) TADs. Profiles of SHM susceptibility (ratio of GFP:Total sequence reads), bottom. (E) Analysis of GFP7 transcription orientation bias in active genes. Top: subset of highly expressed genes analyzed. Bottom: frequencies of GFP7 vectors integrated into these genes in sense (s) or antisense (as) orientation in Total and GFP populations. Paired t test was used. (F) Distribution of hot and cold bins and TADs in chromatin compartment A or B.
Figure 3.
Figure 3.. Examples of SHM-Susceptible and SHM-Resistant TADs
(A–C) Hi-C matrices are shown above DIVAC-trap HTISA data for cold (blue; A) and hot (red; B and C) TADs; HC TADs are indicated by asterisks. CTCF motif orientations (sense, blue; antisense, orange) overlapping with CTCF ChIP-seq peaks for the GM12878 human lymphoblastic cell line are indicated, with other data tracks as in Figure 1. Juxtaposed hot TADs (B) and ~1.2 Mb TAD encompassing and upstream of BCL6 composed of six HC hot sub-TADs (C). Positions of candidate DIVAC-enhancer elements analyzed in Figure 5, red arrows.
Figure 4.
Figure 4.. Epigenetic Environment Associated with SHM Susceptibility
(A) Transcriptional activity (GRO-seq) in hot and cold TADs (reads per kilobase per million mapped reads [RPKM]). Two-tailed t test was used. (B) GFP mean fluorescence intensity (a measure of vector transcriptional activity) and GFP fluorescence loss in 836 cell clones containing the no-DIVAC GFP7 vector (inset, same data plotted on different axes). (C) Enrichment analysis in hot versus cold TADs. The signal for each parameter or factor (log(RPKM)) was compared between hot and cold TADs (two-tailed t test, with p values corrected for multiple hypothesis testing, Bonferroni correction). Corrected p values are plotted; NS, not significant; *p < 1.7 × 10e–3; **p < 1.7 × 10e–6; ***p < 1.7 × 10e–8. Data derived from Ramos: ChIP-seq for the indicated transcription or chromatin factors or modified histones, GRO-seq (GRO), and Assay for Transposase-Accessible Chromatin with high-throughput sequencing (ATAC-seq). NPC, nuclear pore components; Pol II, total RNA polymerase II; S5P, serine-5-phosphorylated Pol II. (D) Analysis of enhancers and super-enhancers in hot and cold TADs. Fraction of TADs that contain one or more super-enhancer is shown (left); fraction of the length of each TAD that is occupied by regular enhancers (middle), or super-enhancers (right). Data for all hot and cold TADs are shown. Fisher exact test and two-tailed t test were used. (E) Composite graph of NIPBL binding intensity to regulatory elements in hot, cold, and all TADs. (F) Distribution of NIPBL binding and SHM susceptibility in hot TADs. Hot TADs were clustered based on similarities in their distribution of normalized NIPBL intensities into six groups (rows). NIPBL distribution (top heatmap) and distribution of SHM susceptibility (bottom heatmap) is shown for the six groups of TADs. Scale bars at right. (G) Plot of correlation coefficients obtained by comparing the distribution of NIPBL binding intensity and SHM susceptibility for each pair of rows in the data from (F).
Figure 5.
Figure 5.. Identification and Characterization of Non-Ig DIVAC Elements
(A) GFP fluorescence loss (3 weeks of culture) in Ramos clones infected with GFP7 containing no-DIVAC, IgHi, or candidate enhancer elements from loci, as indicated below the graph. Data presented as in Figure 1B. Data points outside the y axis range are in parentheses. Elements with detectable DIVAC activity, red arrows; schematic of GFP7, above. (B) NIPBL ChIP-seq signal at the strongest NIPBL binding site in candidate enhancer elements in their endogenous context. IgHi and non-Ig elements exhibiting or lacking DIVAC activity, green, red, and blue, respectively. (C) GFP fluorescence loss and mean GFP fluorescence intensity of clones infected with GFP7 containing ELF1e or ZCCHC7e. Vector integration sites in hot or cold TADs are indicated by red and blue bars, respectively. GFP fluorescence loss values are shown above the bars. (D) ChIP-qPCR analysis of NIPBL binding in two independent Ramos clones harboring GFP7-ELF1e integrated in different cold TADs. Binding at endogenous ELF1e (endoELF1e) and vector ELF1e (vector ELF1e) was assessed within the major NIPBL peak; vector ELF1e contained two 5-bp substitutions to allow the design of primers specific for ectopic ELF1e. Each data point represents an independent measurement (average of duplicate technical replicas); bar indicates mean. C1, a NIPBL-non-binding region (based on NIPBL ChIP-seq data) in the TAD where the vector integrated in clone 1; H3, histone H3; IgG, control ChIP with non-specific antibody.
Figure 6.
Figure 6.. Deletion Analysis of ELF1e DIVAC Element
(A) Hi-C and DIVAC-trap HTISA data for the ELF1 locus, presented as in Figure 3. Red arrow, location of ELF1e element. (B) GFP fluorescence loss (3 weeks of culture) in Ramos clones infected with GFP7 containing no-DIVAC, ELF1e, or truncation mutants of ELF1e. Data are presented as in Figure 5A. Data points outside of the y axis range are in parentheses. (C) Diagram of entire ELF1e element with tracks for NIPBL, H3K27Ac, H3K4me1, H3K4me3, and GRO-seq. Locations of binding motifs for transcription factors (Z, ZEB1; P, PU.1; M, MEF2; E, E2A; B, BCL6; Y, YY1) are marked. The region of ELF1e retained in the mutants in (B) or deleted from the mutants in (D) is indicated with color-coded bars. (D) Analysis as in (B), but using GFP7 vectors in which small regions were deleted from full-length ELF1e. Deleted regions 1–3 are indicated in (C). Data points outside the y axis range are in parentheses.
Figure 7.
Figure 7.. DIVAC Insertion Transforms a Cold TAD into a SHM-Susceptible Genomic Region
(A) DIVAC-trap HTISA data before and after superDIVAC insertion into chromosome 22. Coverage (read numbers in the total cell population) was higher in the chromosome 22 superDIVAC insertion experiment than in the experiment with unmodified Ramos. Data presented as in Figure 3. Red arrow, location of superDIVAC insertion. (B) SHM susceptibility (ratio between GFP and Total sequence read numbers) data for modified TADs and their flanking TADs in unmodified Ramos (no-DIVAC) and Ramos with superDIVAC insertion in chromosome 22 (SD in chromosome 22 TAD) and chromosome 11 (SD in chromosome 11 TAD). (C) Model for SHM susceptibility. We propose that SHM susceptibility arises in TADs that bind NIPBL strongly (green peaks) and contain one or more enhancers with DIVAC activity (purple oval) that bind transcription factors (yellow shapes) resembling those bound by Ig enhancers and interact with promoters (arrow) efficiently due to NIPBL-mediated recruitment of cohesin (red rings) and loop extrusion and/or through other mechanisms, such as phase separation, that could facilitate intra-TAD interactions. It is not known how DIVAC elements increase SHM, although one possibility raised by our findings is an increase in paused/arrested RNA Pol II, creating a favorable single-stranded DNA substrate for AID. Potential loop extrusion-independent roles for cohesin and cohesin-independent roles for NIPBL are not depicted. Arrowheads, convergently oriented CTCF binding sites.

References

    1. Aljanabi SM, and Martinez I (1997). Universal and rapid salt-extraction of high quality genomic DNA for PCR-based techniques. Nucleic Acids Res. 25, 4692–4693. - PMC - PubMed
    1. Álvarez-Prado AF, Pérez-Durán P, Pérez-García A, Benguria A, Torroja C, de Yébenes VG, and Ramiro AR (2018).A broad atlas of somatic hypermutation allows prediction of activation-induced deaminase targets. J. Exp. Med 215, 761–771. - PMC - PubMed
    1. Arakawa H, Kudo H, Batrak V, Caldwell RB, Rieger MA, Ellwart JW, and Buerstedde JM (2008). Protein evolution by hypermutation and selection in the B cell line DT40. Nucleic Acids Res. 36, e1. - PMC - PubMed
    1. Basso K, and Dalla-Favera R (2012). Roles of BCL6 in normal and transformed germinal center B cells. Immunol. Rev 247, 172–183. - PubMed
    1. Bintu B, Mateo LJ, Su JH, Sinnott-Armstrong NA, Parker M, Kinrot S, Yamaya K, Boettiger AN, and Zhuang X (2018). Super-resolution chromatin tracing reveals domains and cooperative interactions in single cells. Science 362, eaau1783. - PMC - PubMed

Publication types