. 2019 Dec 17;29(12):4200-4211.e7.
doi: 10.1016/j.celrep.2019.11.065.

Spatial Genome Re-organization between Fetal and Adult Hematopoietic Stem Cells

Affiliations

Spatial Genome Re-organization between Fetal and Adult Hematopoietic Stem Cells

Changya Chen et al. Cell Rep. .

Abstract

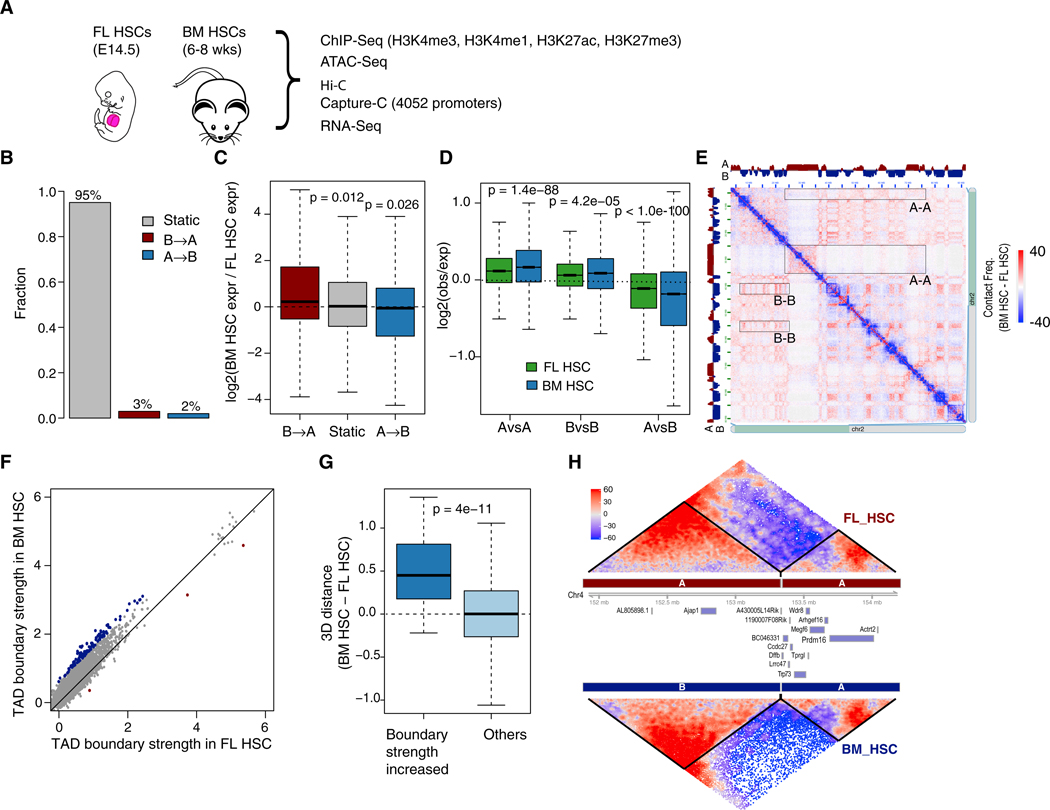
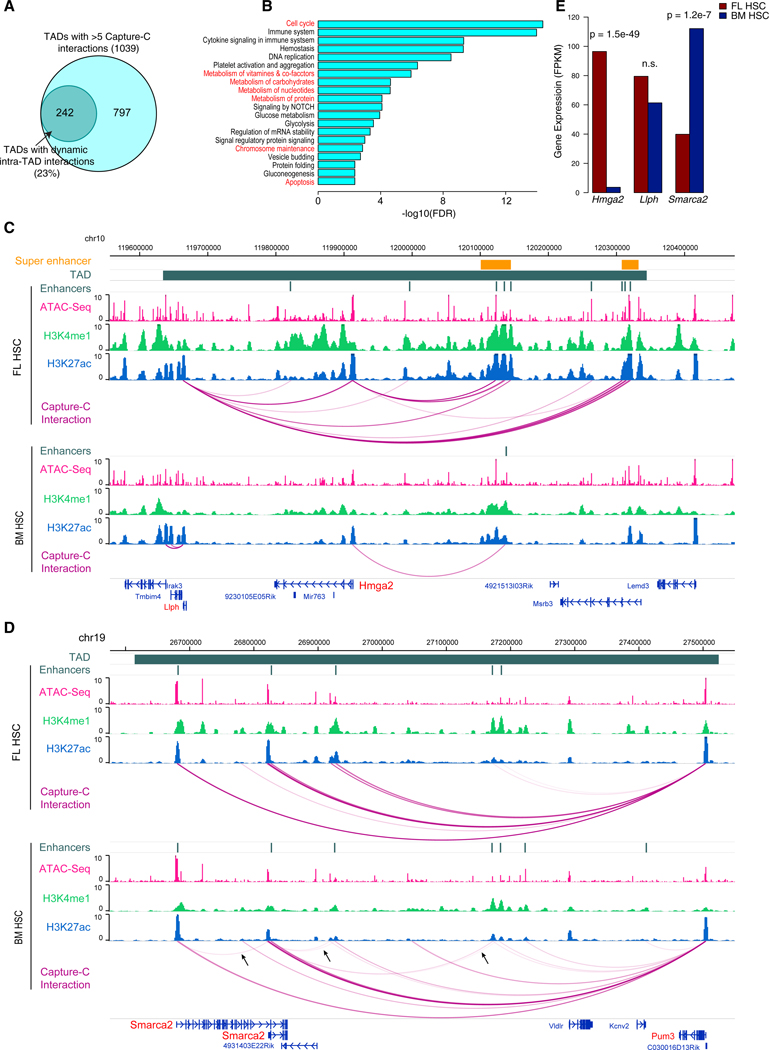
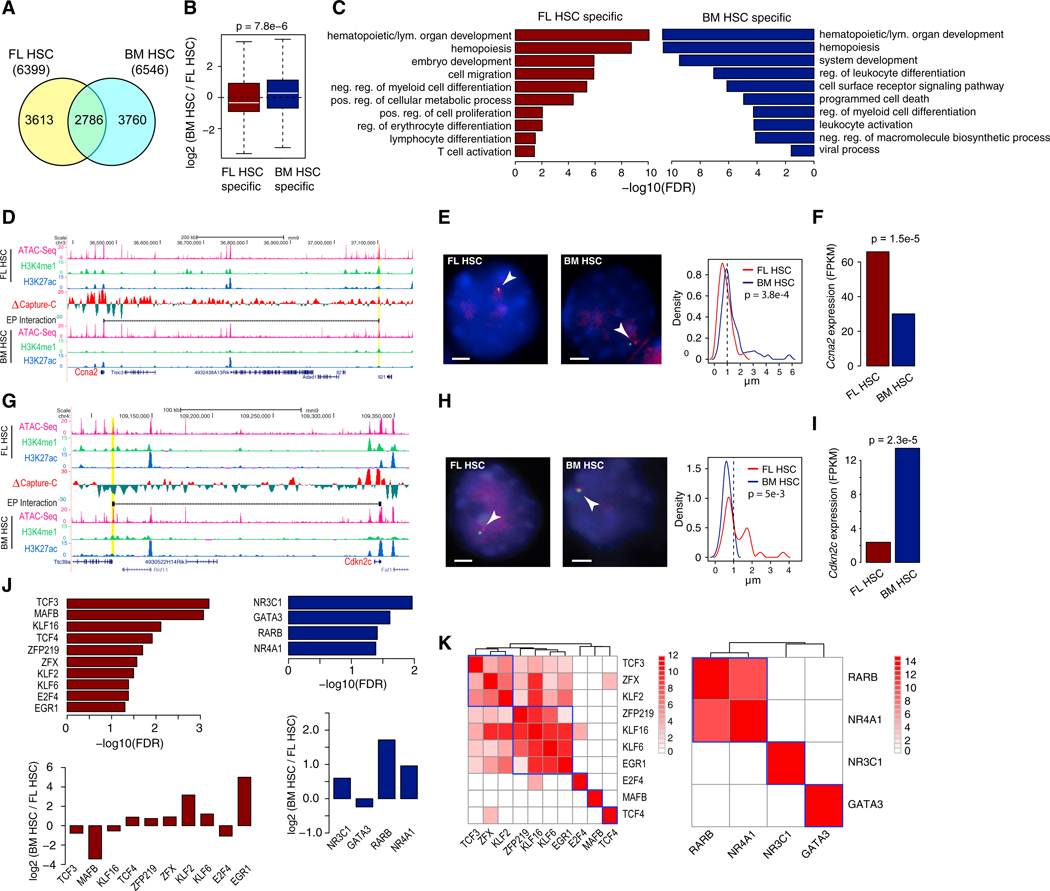
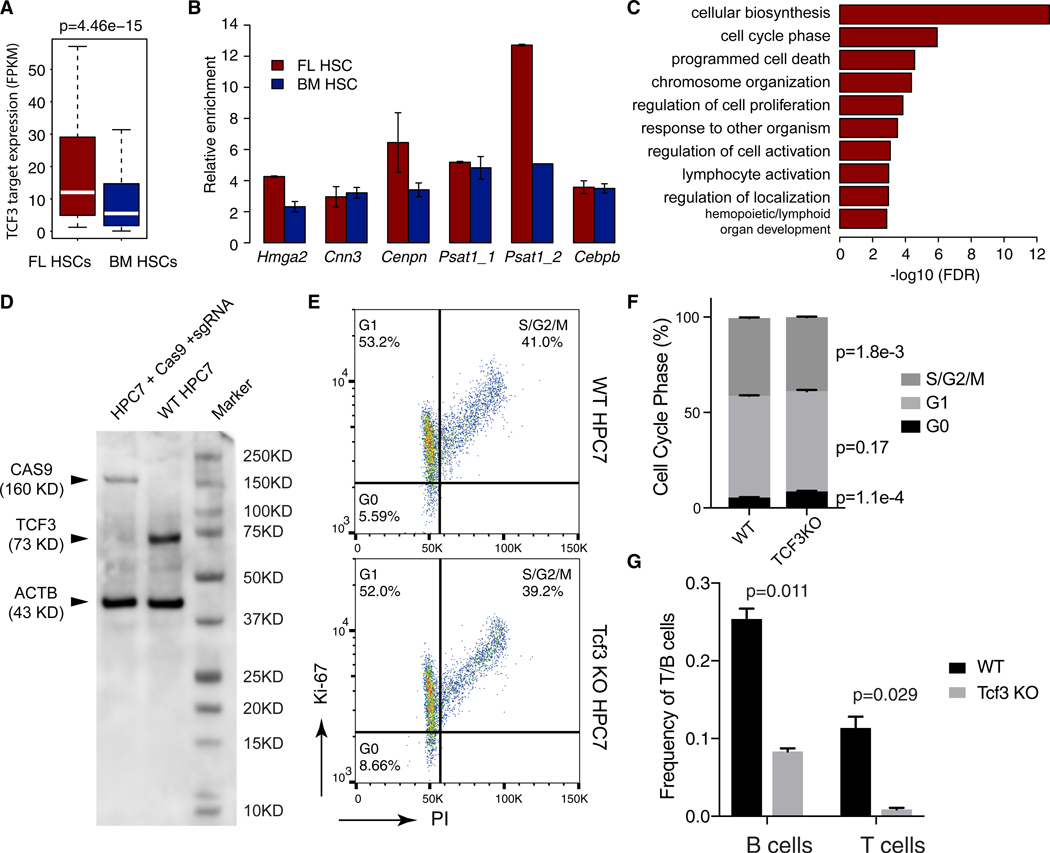
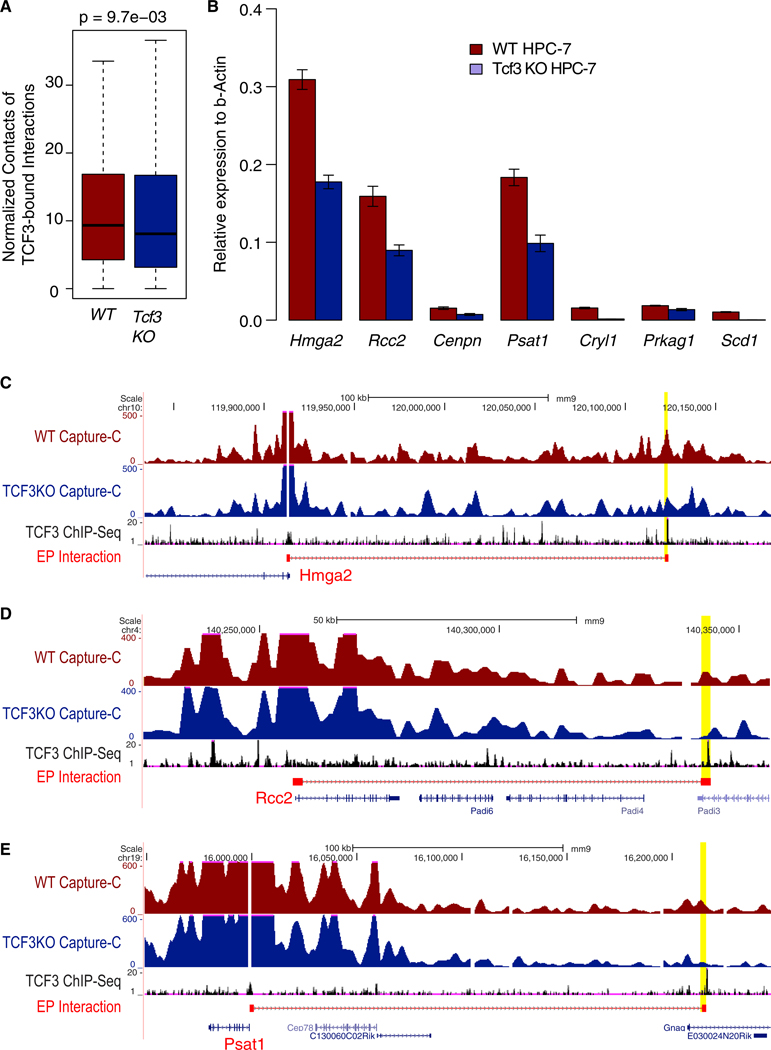
Fetal hematopoietic stem cells (HSCs) undergo a developmental switch to become adult HSCs with distinct functional properties. To better understand the molecular mechanisms underlying the developmental switch, we have conducted deep sequencing of the 3D genome, epigenome, and transcriptome of fetal and adult HSCs in mouse. We find that chromosomal compartments and topologically associating domains (TADs) are largely conserved between fetal and adult HSCs. However, there is a global trend of increased compartmentalization and TAD boundary strength in adult HSCs. In contrast, intra-TAD chromatin interactions are much more dynamic and widespread, involving over a thousand gene promoters and distal enhancers. These developmental-stage-specific enhancer-promoter interactions are mediated by different sets of transcription factors, such as TCF3 and MAFB in fetal HSCs, versus NR4A1 and GATA3 in adult HSCs. Loss-of-function studies of TCF3 confirm the role of TCF3 in mediating condition-specific enhancer-promoter interactions and gene regulation in fetal HSCs.

Keywords: 3D genome; enhancer-promoter interaction; epigenomics; hematopoiesis; transcriptome.


Figures

Figure 1.
Figure 1.. Limited Change in Global 3D Genome Organization during Fetal-to-Adult HSC Transition
(A) Schematic diagram of experimental design. (B) Fraction of genomic regions with compartment switching during fetal to adult transition. B → A, regions switching from compartment B to compartment A; static, regions without compartment switching. (C) Gene expression change is correlated with compartment switching. (D and E) Increased compartmentalization during fetal to adult transition. (D) Shown are log ratios of observed versus expected contact frequencies between TADs from the same (A versus A, B versus B) or different compartments (A versus B). (E) An example heatmap of contact frequencies along chromosome 2, showing increased contacts among regions of the same compartment. Compartment assignment is indicated along the top and left. Several examples of more frequent interactions between the same compartments are highlighted by rectangles. Color is proportional to the difference in contact frequency (BM HSC-FL HSC). Panel was generated by Juicebox. (F) Scatterplot of TAD boundary strength in FL HSCs and BM HSCs. Boundaries with significantly increased and decreased strength (FDR <0.1) are highlighted in blue and red, respectively. (G) 3D distance is larger between adjacent TADs with increased boundary strength during the fetal-to-adult transition. y axis, difference in 3D distance of adjacent TADs between BM HSCs and FL HSCs. Normalized distance was calculated based on the 3D structure model of each chromosome. (H) An example TAD boundary with significantly increased strength during the transition. TAD heatmap color is proportional to SHAMAN score. p values in (C), (D), and (G) were calculated using t test.
Figure 2.
Figure 2.. Intra-TAD Promoter-Centric Interactions Exhibit Large Dynamics
(A) Venn diagram of TADs with dynamic intra-TAD interactions during fetal-to-adult HSC transition. (B) Enriched GO terms among genes in the TADs with dynamic intra-TAD interactions. (C) An example TAD with more promoter-centric interactions in FL HSCs than BM HSCs. Gene promoters with Capture-C baits are highlighted in red. TAD is indicated with a navy green bar. The normalized signals of ATAC-Seq, H3K4me1, H3K27ac, and Capture-C are displayed for FL HSCs (upper tracks) and BM HSCs (lower tracks). Two super enhancers are indicated with an orange bar. (D) An example TAD with more promoter-centric interactions in BM HSCs than FL HSCs (indicated by arrows). (E) Expression levels of three genes, Hmga2, Llph, and Smarca2 in the TAD. p value for differential expression was computed using the edgeR software.
Figure 3.
Figure 3.. Dynamic Enhancer-Promoter (EP) Interactions Account for Phenotypic Differences between FL and BM HSCs
(A) Venn diagram of EP interactions detected by Capture-C. >60% EP interactions are cell-type-specific. (B) Expression change of genes with cell-specific EP interactions. Expression change was calculated as fragments per kilobase of transcript per million mapped reads (FPKM) ratio of BM HSCs to FL HSCs. p value was calculated using t test. (C) Enriched GO terms of genes with FL HSC-specific and BM HSC-specific EP interactions. (D) An example of FL HSC-specific EP interactions involving the promoter of Ccna2. Difference in normalized Capture-C signal is shown in the middle track. Normalized ATAC-seq signal, H3K4me1, and H3K27ac ChIP-seq signals are displayed in the rest of the tracks. Gene whose promoter was used as Capture-C bait is marked as red. (E) DNA FISH confirms the de novo FL HSC-specific EP interaction. Left: representative DNA FISH images of the Ccna2 promoter (red) and enhancer (green) in FL HSCs (left panel) and BM HSCs (right panel). Interaction is denoted by a white arrow. Right: frequency of the quantified distance distribution between Ccna2 promoter and the enhancer (μm) (# nuclei imaged: 90 and 59 for FL HSC and BM HSC, respectively). p value was calculated using t test. Scale bars, 2 μm. (F) Gene expression level of Ccna2. p value of differential expression was calculated using edgeR. (G) An example of BM HSC-specific EP interaction involving the promoter of Cdkn2c. (H) DNA FISH confirmation of the EP interaction. Scale bars, 2 μm. (I) Gene expression level of Cdkn2c. (J) Enriched TF DNA binding motifs at enhancers of FL HSC-specific and BM HSC-specific EP interactions. Bottom plots, expression levels of the TFs with enriched motifs. (K) Co-localization of enriched TF motifs at enhancers of cell-specific EP interactions. Color of heatmap is proportional to the p value of co-localization. Heatmap was clustered using hierarchical clustering.
Figure 4.
Figure 4.. TCF3 Occupies Developmental-Stage-Specific Enhancer-Promoter Loops and Affects Cell-Cycle Phase and Lineage Potential
(A) FL HSC-specific TCF3 targets have significantly higher expression. (B) ChIP-qPCR confirmation of TCF3 binding to enhancers involved in FL HSC-specific EP loops. (C) Enriched GO terms among genes targeted by FL HSC-specific EP loops occupied by TCF3. (D) Western blot showing knock down of TCF3 by CRISPR-Cas9. (E and F) Cell cycle phase analysis by co-staining with propidium iodide and anti-Ki-67 antibody. (E) Representative fluorescence-activated cell sorting (FACS) plots of wild-type and Tcf3 knockout HPC-7 cells. (F) Quantification of cell cycle phases, mean ± SD of three biological replicates. p values were computed using t test. (G) Limiting dilution assay showing significantly reduced lymphoid potential in Tcf3 knockout HPC-7 cells. y axis, frequencies of CD45+CD25+CD90+ T progenitors and CD45+B220+CD19+ B progenitors produced by wild-type and Tcf3 knockout HPC-7 cells after 10–12 days of co-culturing with OP9/OP9-DL1 cells. Values are mean of 2 biological replicate experiments. Error bar, SD.
Figure 5.
Figure 5.. Loss of TCF3 Results in Loss of Cell-Specific Enhancer-Promoter Loops and Deregulation of Target Gene Expression
(A) Reduced interaction frequency among TCF3 bound enhancer-promoter loops after knocking down Tcf3. (B) qRT-PCR of target genes of TCF3 bound enhancer-promoter loops. (C–E) Capture-C data showing loss of enhancer-promoter interaction after Tcf3 knock down for Hmga2 (C), Rcc2 (D), and Psat1 (E).

References

    1. Adolfsson J, Borge OJ, Bryder D, Theilgaard-Mönch K, Astrand-Grund-ström I, Sitnicka E, Sasaki Y, and Jacobsen SE (2001). Upregulation of Flt3 expression within the bone marrow Lin(−)Sca1(+)c-kit(+) stem cell compartment is accompanied by loss of self-renewal capacity. Immunity 15, 659–669. - PubMed
    1. Ali N, Karlsson C, Aspling M, Hu G, Hacohen N, Scadden DT, and Larsson J. (2009). Forward RNAi screens in primary human hematopoietic stem/progenitor cells. Blood 113, 3690–3695. - PMC - PubMed
    1. Belle I, and Zhuang Y. (2014). E proteins in lymphocyte development and lymphoid diseases. Curr. Top. Dev. Biol 110, 153–187. - PMC - PubMed
    1. Benz C, Copley MR, Kent DG, Wohrer S, Cortes A, Aghaeepour N, Ma E, Mader H, Rowe K, Day C, et al. (2012). Hematopoietic stem cell subtypes expand differentially during development and display distinct lymphopoietic programs. Cell Stem Cell 10, 273–283. - PubMed
    1. Bonev B, and Cavalli G. (2016). Organization and function of the 3D genome. Nat. Rev. Genet 17, 661–678. - PubMed

Publication types

MeSH terms

Substances