. 2020 Feb 14;126(4):501-516.
doi: 10.1161/CIRCRESAHA.119.315215. Epub 2019 Dec 19.

Longitudinal RNA-Seq Analysis of the Repeatability of Gene Expression and Splicing in Human Platelets Identifies a Platelet SELP Splice QTL

Affiliations

Longitudinal RNA-Seq Analysis of the Repeatability of Gene Expression and Splicing in Human Platelets Identifies a Platelet SELP Splice QTL

Matthew T Rondina et al. Circ Res. .

Abstract

Rationale: Longitudinal studies are required to distinguish within versus between-individual variation and repeatability of gene expression. They are uniquely positioned to decipher genetic signal from environmental noise, with potential application to gene variant and expression studies. However, longitudinal analyses of gene expression in healthy individuals-especially with regards to alternative splicing-are lacking for most primary cell types, including platelets.

Objective: To assess repeatability of gene expression and splicing in platelets and use repeatability to identify novel platelet expression quantitative trait loci (QTLs) and splice QTLs.

Methods and results: We sequenced the transcriptome of platelets isolated repeatedly up to 4 years from healthy individuals. We examined within and between individual variation and repeatability of platelet RNA expression and exon skipping, a readily measured alternative splicing event. We find that platelet gene expression is generally stable between and within-individuals over time-with the exception of a subset of genes enriched for the inflammation gene ontology. We show an enrichment among repeatable genes for associations with heritable traits, including known and novel platelet expression QTLs. Several exon skipping events were also highly repeatable, suggesting heritable patterns of splicing in platelets. One of the most repeatable was exon 14 skipping of SELP. Accordingly, we identify rs6128 as a platelet splice QTL and define an rs6128-dependent association between SELP exon 14 skipping and race. In vitro experiments demonstrate that this single nucleotide variant directly affects exon 14 skipping and changes the ratio of transmembrane versus soluble P-selectin protein production.

Conclusions: We conclude that the platelet transcriptome is generally stable over 4 years. We demonstrate the use of repeatability of gene expression and splicing to identify novel platelet expression QTLs and splice QTLs. rs6128 is a platelet splice QTL that alters SELP exon 14 skipping and soluble versus transmembrane P-selectin protein production.

Keywords: alternative splicing; blood platelets; exons; longitudinal studies; quantitative trait loci; rna-seq; transcriptome.


Conflict of interest statement

DISCLOSURES

The authors declare no conflicts or competing financial interests.

Figures
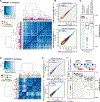
Figure 1.
Figure 1.. Within and between individual stability of platelet RNA expression over 4 months (cohort 1) and 4 years (cohort 2).
A and D: Unsupervised clustering and heatmaps of total RNA expression in platelets from all samples in A) cohort 1 and D) cohort 2. The histograms to the left of each heatmap show the distribution of distances between all pairs of samples, and the darkness of blue indicates the degree of similarity between pairs of samples. Samples that cluster as neighbors in the heatmap dendrograms reflect transcriptomes with the highest similarity. Nearest neighbor self-pairs are highlighted in yellow and gray, whereas nearest neighbor non-self pairs are highlighted in orange. B and E: Example individual correlation plots of all transcripts in B) cohort 1 or E) cohort 2. Each data point represents the regularized, log-transformed expression level (RLD) of a single transcript from the specified donor at time 0 (x axis) versus 0, 2 wk, 4 months, or 4 years (y axis) within the same individual (top panels) or a different individual (bottom panels). Points are heat-colored according to density. P values are from Pearson correlation. C and F: Boxplots summarizing the RNA expression Pearson correlation between all within versus between-individual pairs at C) time 0 and 4 months or F) in aggregate at all time points (left) or at the individually specified time points (right). With regards to specified time points in F, note that the average within-individual correlation did not significantly decrease as samples taken farther apart were compared. For example, there was not a significant difference when comparing the average within-individual correlation of T0 versus 2 weeks with the average within-individual correlation of T0 versus 4 years. Boxplots for cohort 1 (C) are shown before and after adjusting for age, sex, and race, whereas they are not adjusted for cohort 2 (F), because of the smaller sample size. P values are from Wilcox test, adjusted.
Figure 2.
Figure 2.. Comparison between cohorts of the within and total variation of each transcript in platelets.
The mean within and total individual variation (standard deviation, SD) was calculated from the regularized log transformed expression (RLD) for each transcript. A and C: the A) within or C) total individual variation of each transcript in cohort 1 (x-axis) plotted against the respective variation of each transcript in cohort 2 (y-axis). The horizontal and vertical lines at 0.5 marks an arbitrary threshold of variation used for the Venn diagrams in B and D. B and D: Venn diagrams of the overlap in the transcripts with highest B) within and D) total variation. Listed below each Venn are the significantly enriched GO terms for the transcripts overlapping both cohorts. FDR = Benjamini False Discovery Rate calculated by David.
Figure 3.
Figure 3.. Transcripts ranked by repeatability are enriched in heritable traits and eQTLs.
A) Table of transcripts with the highest repeatability in cohort 1 RNA-seq data, and their reported association with race, sex, or eQTLs in PRAX1, microarray data. Associations with FDR < 1e-4 are highlighted in pink. NS = not significant. B) Correlation plot of RNA expression (log normalized) of MFN2 at time 0 (x-axis) and 4 months (y-axis). Points are colored according to rs1474868 genotype (ND = not determined). Above is a density histogram showing a bimodal distribution according to genotype. Bimodal P value from Hartigan’s diptest for multi-modality. C) Top: enrichment plots for the presence of eQTLs ranked according to different measures: within variation, mean expression abundance, total variation, or repeatability. The axis below the plot indicates the gene rank according to each measure, and indicates the value of the repeatability measure (the values of the other measures are not noted on the axis). Genes with a known eQTL are in red, those without are in blue. Thus, genes with the highest repeatability are nearly 100% eQTL genes, whereas those with the lowest repeatability are nearly 0%. Bottom: plot of cumulative enrichment scores for each metric. D) Odds ratios for the likelihood of identifying an eQTL for genes at the indicated repeatability thresholds compared to the same number of genes ranked by total variation. E) Boxplots of LINC01089 expression according to rs1168863 genotype in cohort 1 at time 0 and 4 months and in the NL cohort. *P values adjusted for age, sex, and cohort 1) race or cohort 2) population structure (inferred genetic ancestry,). F) Boxplots demonstrating allelic imbalance of rs1168863 within heterozygotes in cohort 1 and the NL cohort. The proportion of RNA-seq reads with A nucleotide versus T nucleotide was calculated and plotted for each heterozygote individual.
Figure 4.
Figure 4.. Within and between individual stability of exon skipping in platelets.
A) Schematic of how exon skipping events are defined. Percent exon Spliced In (PSI) is calculated using splice junction reads and is the ratio of exon inclusion junction reads over total junction reads. B) Correlation plots the PSI for all exon skipping events within (left panel) and between (right panel) individuals. Each point represents a single exon skipping event from the specified donor at time 0 (x axis) versus 0 or 4 months (y axis). C) Boxplots summarizing Pearson correlations of within versus between-individual pairs when analyzing PSI of all exon skipping events at time 0 and 4 months, and after adjusting for age, sex, and race. *Wilcox test, adjusted.
Figure 5.
Figure 5.. Repeatability of Exon 14 skipping in SELP and association with race.
A: Table of the most repeatable exon skipping events in platelets. B: Representative IGV plots of sequencing reads from two different individuals at time 0 and 4 months, showing the differential distribution of reads between individuals that align to or skip exon 14 of SELP. The histograms indicate the cumulative abundance of reads that aligned to each exon. A subset of individual reads is shown below each histogram that indicate split splice junction reads by thin lines (absent in read) that connect to thick lines (mapped portion of read). Red and blue reads are splice junction reads that align to or skip exon 14 respectively. C: Correlation plot of SELP exon 14 PSI. Each point represents the PSI for an individual donor at time 0 (x-axis) and 4 months (y-axis). Donors represented in the IGV plots in B are labeled in red text. D) Boxplot of SELP exon 14 mean PSI according to race at T=0 and T=4 months.
Figure 6.
Figure 6.. rs6128 is a platelet SELP exon 14 splice QTL.
A) Close up IGV plot showing read distribution across SELP exon 14 for Top) an individual with rs6128 A/A and relatively high levels of exon skipping reads or Bottom) an individual with rs6128 (T/T) variant. The C->T change does not change amino acid sequence, but alters exonic splicing silencer and enhancer sites as predicted by Ex-Skip. B) Boxplot of SELP exon 14 mean PSI according to rs6128 genotype inferred from RNA-seq in cohort 1 at time 0 and 4 months. C) Boxplot of SELP exon 14 mean PSI according to rs6128 genotype inferred from RNA-seq data published in the NL cohort. *P values adjusted for age, sex, and B) race or C) population structure (inferred genetic ancestry,).
Figure 7.
Figure 7.. rs6128 directly regulates exon 14 skipping in SELP and alters the ratio of surface to soluble P-selectin protein expression.
A) Schematic of mini-gene constructs of SELP that include the ORF of SELP, and the introns flanking exon 14. The C/C and T/T constructs vary by a single nucleotide at rs6128. Constructs were cloned into vectors with 2 different promoters (CMV or MSCV). After transfection into HEK 293 cells, the introns are spliced out and exon 14 is variably spliced out (skipped). The extent of exon 14 skipping is measured by PCR via exon 14 flanking primers that generate two PCR products of different sizes. B) RT-PCR analysis of SELP exon 14 skipping following transfection of HEK 293 cells with rs6128 C/C or T/T vectors. Shown is a representative result from 5 independent experiments. Below are bar graphs and standard error summary of PSI calculated according to densitometry analysis of the exon 14 inclusion band (upper band) divided by the sum of the upper and lower bands (total).*paired t-test, n=5 independent experiments. C) Flow cytometry analysis of P-selectin surface expression following transfection of HEK 293 cells with rs6128 C/C or T/T vectors. Top is a representative histogram overlay of P-selectin surface expression 24 hours after transfection with CMV promoter empty vector, rs6128 C/C, or T/T. Below are bar graph and standard error summaries of the fold change (normalized to transfection) of surface P-selectin MFI following transfection. *paired T test, n=5–6 pairs per group. D) ELISA analysis of soluble P-selectin in supernatants of HEK 293 cells following transfection with rs6128 C/C or T/T vectors. *paired T test, n=12–14 pairs per group.

References

    1. Rowley JW, Oler AJ, Tolley ND, Hunter BN, Low EN, Nix DA, Yost CC, Zimmerman GA, Weyrich AS. Genome-wide RNA-seq analysis of human and mouse platelet transcriptomes. Blood. 2011;118:e101–e111. - PMC - PubMed
    1. Bray PF, McKenzie SE, Edelstein LC, Nagalla S, Delgrosso K, Ertel A, Kupper J, Jing Y, Londin E, Loher P, Chen HW, Fortina P, Rigoutsos I. The complex transcriptional landscape of the anucleate human platelet. BMC Genomics. 2013;14:1. - PMC - PubMed
    1. Gnatenko D V, Dunn JJ, McCorkle SR, Weissmann D, Perrotta PL, Bahou WF. Transcript profiling of human platelets using microarray and serial analysis of gene expression. Blood. 2003;101:2285–93. - PubMed
    1. Beliakova-Bethell N, Massanella M, White C, Lada S, Du P, Vaida F, Blanco J, Spina CA, Woelk CH. The effect of cell subset isolation method on gene expression in leukocytes. Cytometry A. 2014;85:94–104. - PMC - PubMed
    1. Bhattacharjee J, Das B, Mishra A, Sahay P, Upadhyay P. Monocytes isolated by positive and negative magnetic sorting techniques show different molecular characteristics and immunophenotypic behaviour. F1000Research. 2017;6:2045. - PMC - PubMed

Publication types