. 2020 Mar 1;26(5):1094-1104.
doi: 10.1158/1078-0432.CCR-19-0909. Epub 2019 Dec 18.

Genomic and Phenotypic Characterization of a Broad Panel of Patient-Derived Xenografts Reflects the Diversity of Glioblastoma

Affiliations

Genomic and Phenotypic Characterization of a Broad Panel of Patient-Derived Xenografts Reflects the Diversity of Glioblastoma

Rachael A Vaubel et al. Clin Cancer Res. .

Abstract

Purpose: Glioblastoma is the most frequent and lethal primary brain tumor. Development of novel therapies relies on the availability of relevant preclinical models. We have established a panel of 96 glioblastoma patient-derived xenografts (PDX) and undertaken its genomic and phenotypic characterization.

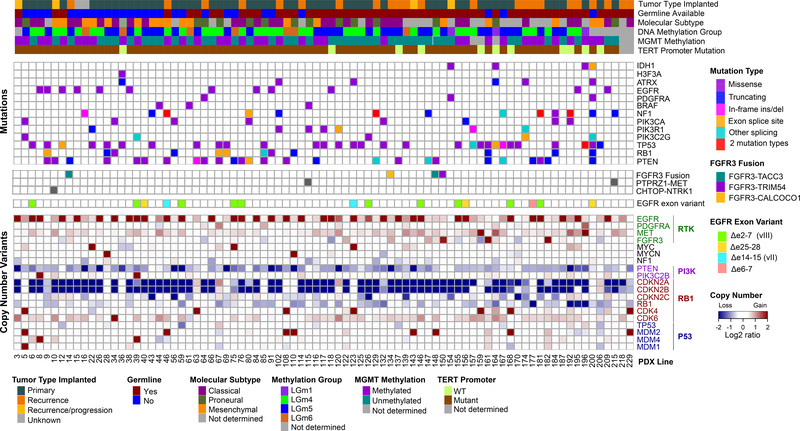
Experimental design: PDXs were established from glioblastoma, IDH-wildtype (n = 93), glioblastoma, IDH-mutant (n = 2), diffuse midline glioma, H3 K27M-mutant (n = 1), and both primary (n = 60) and recurrent (n = 34) tumors. Tumor growth rates, histopathology, and treatment response were characterized. Integrated molecular profiling was performed by whole-exome sequencing (WES, n = 83), RNA-sequencing (n = 68), and genome-wide methylation profiling (n = 76). WES data from 24 patient tumors was compared with derivative models.

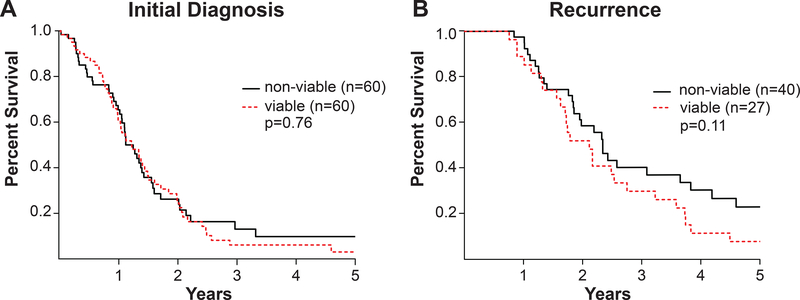
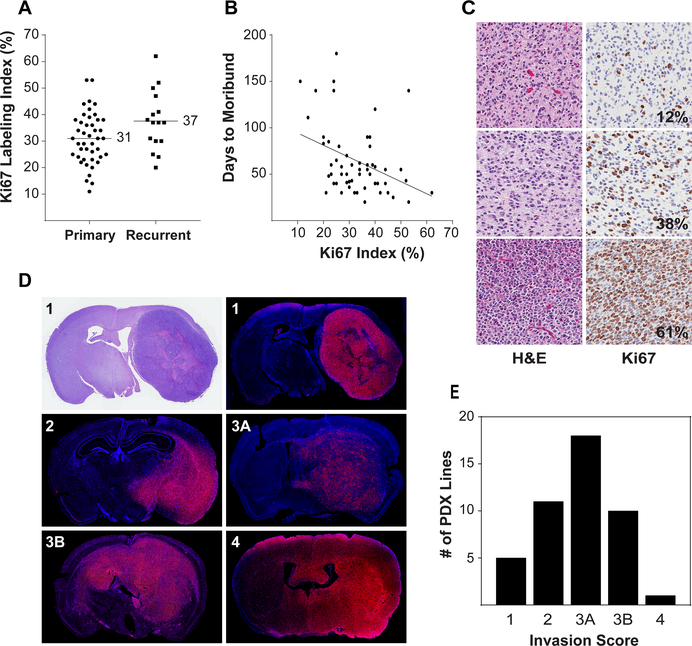
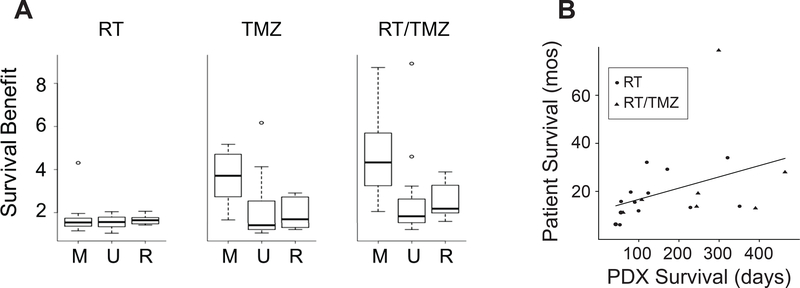
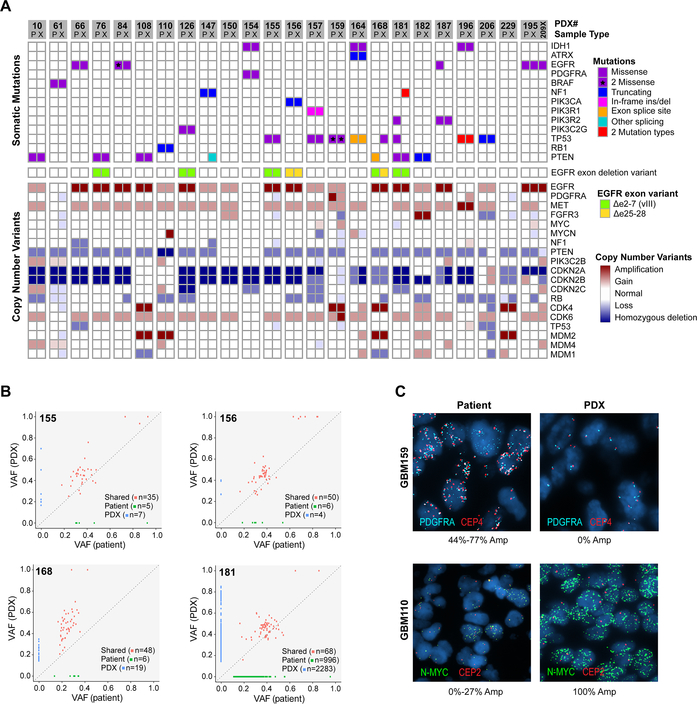
Results: PDXs recapitulate many key phenotypic and molecular features of patient tumors. Orthotopic PDXs show characteristic tumor morphology and invasion patterns, but largely lack microvascular proliferation and necrosis. PDXs capture common and rare molecular drivers, including alterations of TERT, EGFR, PTEN, TP53, BRAF, and IDH1, most at frequencies comparable with human glioblastoma. However, PDGFRA amplification was absent. RNA-sequencing and genome-wide methylation profiling demonstrated broad representation of glioblastoma molecular subtypes. MGMT promoter methylation correlated with increased survival in response to temozolomide. WES of 24 matched patient tumors showed preservation of most genetic driver alterations, including EGFR amplification. However, in four patient-PDX pairs, driver alterations were gained or lost on engraftment, consistent with clonal selection.

Conclusions: Our PDX panel captures the molecular heterogeneity of glioblastoma and recapitulates many salient genetic and phenotypic features. All models and genomic data are openly available to investigators.


Figures

Figure 1:
Figure 1:. Patient overall survival.
(A-B) Overall survival of patients with grade IV astrocytomas forming viable vs. non-viable xenografts. Kaplan-Meier plots for (A) newly diagnosed and (B) recurrent grade IV astrocytomas. p-value, log-rank test.
Figure 2:
Figure 2:. Proliferation and invasiveness of orthotopic PDX.
(A) Distribution of Ki67 labeling in PDX derived from primary and recurrent tumors. Ki67 labeling index was determined from tissue microarray cores from 58 orthotopic PDX lines. A mean of 4.5 cores was analyzed from one (n=4) or two (n=54) independent orthotopic tumors for each line. (B) Inverse correlation of Ki67 labeling with time to moribund following intracranial injection of tumor cells. (C) Representative H&E and Ki67 staining for PDX with low, moderate, and high Ki67 labeling indexes. (D) Tumor cell invasion was assessed by immunofluorescence using human specific antibodies to Lamin A/C. Representative sections showing invasion pattern scoring: 1 = unilateral, well-demarcated tumor; 2 = unilateral with infiltrating border; 3A = bilateral, restricted to contralateral midline structures; 3B = bilateral with clear involvement of both hemispheres; 4 = diffuse infiltration bilaterally. (E) Distribution of invasion patterns for 55 orthotopic PDX.
Figure 3:
Figure 3:. Integrated genomic characterization of 83 PDX lines.
Mutations and copy number variants (CNVs) from WES are shown for core glioma genetic drivers. When available (n=55), patient germline variants were subtracted. Molecular gene expression subtype was determined from RNAseq (14). DNA methylation group was determined from genome wide methylation profiling according to TCGA pan-glioma classification (15). MGMT promoter methylation was assessed by quantitative methylation-specific PCR performed at Mayo Clinic. TERT promoter mutations (C228T and C250T) were detected by Sanger sequencing.
Figure 4:
Figure 4:. Response to standard therapies.
(A) Survival benefit across PDX models treated with RT, TMZ and RT/TMZ. Mice with established orthotopic tumors from 37 PDX lines were randomized to treatment with RT, TMZ, or RT/TMZ. Survival benefit was calculated as a ratio of survival of the treated mice to placebo treated mice. PDXs are grouped by MGMT status: M=MGMT methylated (N=14), U=MGMT unmethylated (N=14) and R=recurrent (N=9). (B) Comparison of patient and PDX survival following standard therapies for 20 matched pairs with xenografts established at initial diagnosis. Patient survival is shown in months and PDX survival in days.
Figure 5:
Figure 5:. Comparison of somatic alterations in 24 matched patient tumors and derivative PDX.
(A) Somatic mutations and CNVs involving core glioma associated genes. Matched patient (P) and derivative PDX (X) models are adjacent for each pair. The GBM195 patient-PDX pair is also shown with GBM209 (209X), a PDX line established from the patient’s subsequent tumor recurrence. (B) Representative scatterplots comparing variant allele frequency (VAF) of four patient-PDX pairs. The four selected pairs reflect the spectrum of SNV conservation across the matched patient-PDX pairs. (C) FISH of matched patient and PDX tissue showing subclonal amplifications of N-MYC (GBM110) and PDGFRA (GBM159). Two distinct PDGFRA amplified subclones could be distinguished in the patient tumor by involvement of the centromeric probe (CEP4). %Amp denotes the percentage of tumor cells with >8 copies of the target probe with range given across 3 patient tumor blocks.

References

    1. Allen M, Bjerke M, Edlund H, Nelander S, Westermark B. Origin of the U87MG glioma cell line: Good news and bad news. Sci Transl Med 2016;8(354):354re3 doi 10.1126/scitranslmed.aaf6853. - DOI - PubMed
    1. Torsvik A, Stieber D, Enger PO, Golebiewska A, Molven A, Svendsen A, et al. U-251 revisited: genetic drift and phenotypic consequences of long-term cultures of glioblastoma cells. Cancer Med 2014;3(4):812–24 doi 10.1002/cam4.219. - DOI - PMC - PubMed
    1. Lenting K, Verhaak R, Ter Laan M, Wesseling P, Leenders W. Glioma: experimental models and reality. Acta Neuropathol 2017;133(2):263–82 doi 10.1007/s00401-017-1671-4. - DOI - PMC - PubMed
    1. Lee J, Kotliarova S, Kotliarov Y, Li A, Su Q, Donin NM, et al. Tumor stem cells derived from glioblastomas cultured in bFGF and EGF more closely mirror the phenotype and genotype of primary tumors than do serum-cultured cell lines. Cancer Cell 2006;9(5):391–403 doi 10.1016/j.ccr.2006.03.030. - DOI - PubMed
    1. Schulte A, Gunther HS, Martens T, Zapf S, Riethdorf S, Wulfing C, et al. Glioblastoma stem-like cell lines with either maintenance or loss of high-level EGFR amplification, generated via modulation of ligand concentration. Clin Cancer Res 2012;18(7):1901–13 doi 10.1158/1078-0432.CCR-11-3084. - DOI - PubMed

Publication types

MeSH terms