. 2019 Dec 19;4(24):e127441.
doi: 10.1172/jci.insight.127441.

Targeting liver stage malaria with metformin

Affiliations

Targeting liver stage malaria with metformin

Iset Medina Vera et al. JCI Insight. .

Abstract

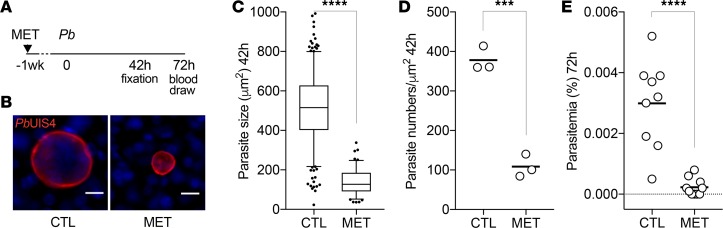
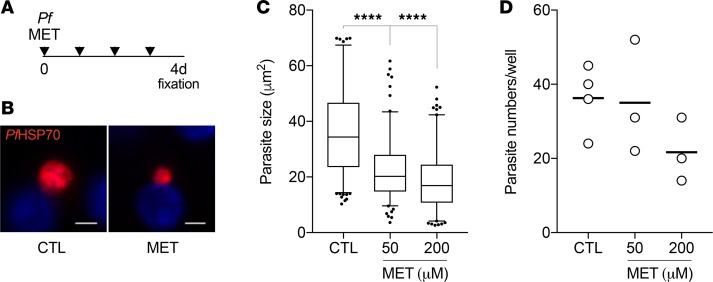
Despite an unprecedented 2 decades of success, the combat against malaria - the mosquito-transmitted disease caused by Plasmodium parasites - is no longer progressing. Efforts toward eradication are threatened by the lack of an effective vaccine and a rise in antiparasite drug resistance. Alternative approaches are urgently needed. Repurposing of available, approved drugs with distinct modes of action are being considered as viable and immediate adjuncts to standard antimicrobial treatment. Such strategies may be well suited to the obligatory and clinically silent first phase of Plasmodium infection, where massive parasite replication occurs within hepatocytes in the liver. Here, we report that the widely used antidiabetic drug, metformin, impairs parasite liver stage development of both rodent-infecting Plasmodium berghei and human-infecting P. falciparum parasites. Prophylactic treatment with metformin curtails parasite intracellular growth in vitro. An additional effect was observed in mice with a decrease in the numbers of infected hepatocytes. Moreover, metformin provided in combination with conventional liver- or blood-acting antimalarial drugs further reduced the total burden of P. berghei infection and substantially lessened disease severity in mice. Together, our findings indicate that repurposing of metformin in a prophylactic regimen could be considered for malaria chemoprevention.

Keywords: Drug therapy; Infectious disease; Malaria; Microbiology; Parasitology.


Conflict of interest statement

Conflict of interest: The authors have declared that no conflict of interest exists.

Figures

Figure 1
Figure 1. Metformin treatment inhibits P. berghei liver infection in mice.
(A) Timeline of drug treatment, infection, and sample collection. C57BL/6 mice were injected intravenously with GFP-expressing P. berghei sporozoites (10,000 inoculum for BD, 500 inoculum for E). Metformin (MET, 500 mg/kg/d) was given prophylactically in the drinking water 1 week before and during infection. Nontreated control (CTL) received regular water. Livers were harvested at 42 hours and tail blood was collected 72 hours after infection. (B) Representative immunofluorescence images of P. berghei schizonts in liver sections at 42 hours after infection. Parasites were visualized using anti-GFP (not shown) to detect the reporter transgene and anti-PbUIS4, a parasitophorous membrane marker (shown in red). Nuclei were stained with Hoechst (shown in blue). Scale bar: 10 μm. (C) Box plot of P. berghei size distribution in liver sections at 42 hours. The total number of parasites analyzed in 3 infected mice per group is 377, CTL; and 115, MET. The outliers in the box plots represent 5% of data points. The box plots depict the minimum and maximum values (whiskers), the upper and lower quartiles, and the median. The length of the box represents the interquartile range. Mann-Whitney U test, ****P < 0.0001. (D) Scatter plot of parasite density per square micrometer of infected liver sections at 42 hours. Each dot represents one animal and the horizontal bar represents the mean. Student’s t test, ***P < 0.001. (E) Scatter plot showing the percentage of infected erythrocytes (parasitemia) measured by flow cytometry 72 hours after infection. Each dot represents 1 animal and the horizontal bar represents the mean. The total number of mice analyzed in 2 independent experiments is 9, CTL; and 10, MET. Mann-Whitney U test, ****P < 0.0001.
Figure 2
Figure 2. Metformin treatment reduces P. falciparum development in human hepatocytes.
(A) Timeline of metformin treatment, infection, and sample collection. Primary human hepatocytes were infected with 60,000 P. falciparum sporozoites. Prophylactic dosing of metformin (50 and 200 μM) started at 3 hours after infection and repeated daily. Cultures were fixed at day 4 after infection. (B) Representative immunofluorescence images of P. falciparum parasites stained with anti-PfHSP70 antibodies (shown in red) for nontreated control and 200 μM metformin treatment. Nuclei were stained with Hoechst (shown in blue). Scale bar: 5 μm. (C and D) Quantification of P. falciparum size distribution (C) and density (D) at day 4 after infection. The total number of parasites analyzed in 2 independent experiments is 190, CTL; 143, MET 50 μM; 140, MET 200 μM. The outliers in the box plots represent 5% of data points. The box plots depict the minimum and maximum values (whiskers), the upper and lower quartiles, and the median. The length of the box represents the interquartile range. The dots in the scatter plot represent 1 well, and the horizontal bars show the mean, in 1 of the 2 experiments. Ordinary 1-way ANOVA test, ****P < 0.0001.
Figure 3
Figure 3. Combined metformin treatment with suboptimal doses of primaquine or mefloquine improves antimalarial effect.
(A) Timeline of drug treatments, infections, and sample collection. C57BL/6 mice were injected intravenously with 500 GFP-expressing P. berghei sporozoites. Metformin (500 mg/kg/d) was provided in the drinking water 1 week before and during infection. Primaquine (PQ, 15 mg/kg) was injected 1 time intraperitoneally 2 hours after infection. Mefloquine (MQ, 10 mg/kg) was given daily by intraperitoneal injection. (B and C) Scatter plot showing the percentage of infected erythrocytes (parasitemia) measured by flow cytometry at day 3 (72 hours, B) and day 5 (C) after infection. Each dot represents 1 animal. The horizontal bar represents the mean. The total number of mice analyzed is as follows: 10, CTL; 10, MET; 10, PQ; 10, MET/PQ; 5, MQ; and 5, MET/MQ. P values calculated relative to nontreated CTL (B) and relative to MET (C). Ordinary 1-way ANOVA test, ****P < 0.0001; **P < 0.01; *P < 0.05; ns, not significant.

References

    1. World Health Organization. World Malaria Report 2010. http://www.who.int/malaria/world_malaria_report_2010/en/index.html Accessed November 18, 2019.
    1. Vaughan AM, Kappe SHI. Malaria parasite liver infection and exoerythrocytic biology. Cold Spring Harb Perspect Med. 2017;7(6):a025486. doi: 10.1101/cshperspect.a025486. - DOI - PMC - PubMed
    1. Holz LE, Fernandez-Ruiz D, Heath WR. Protective immunity to liver-stage malaria. Clin Transl Immunology. 2016;5(10):e105. doi: 10.1038/cti.2016.60. - DOI - PMC - PubMed
    1. Hooft van Huijsduijnen R, Wells TN. The antimalarial pipeline. Curr Opin Pharmacol. 2018;42:1–6. doi: 10.1016/j.coph.2018.05.006. - DOI - PubMed
    1. Watson J, Taylor WRJ, Bancone G, Chu CS, Jittamala P, White NJ. Implications of current therapeutic restrictions for primaquine and tafenoquine in the radical cure of vivax malaria. PLoS Negl Trop Dis. 2018;12(4):e0006440. doi: 10.1371/journal.pntd.0006440. - DOI - PMC - PubMed

Publication types

MeSH terms