. 2019 Dec 18;10(1):5642.
doi: 10.1038/s41467-019-13647-8.

Automated acquisition of explainable knowledge from unannotated histopathology images

Affiliations

Automated acquisition of explainable knowledge from unannotated histopathology images

Yoichiro Yamamoto et al. Nat Commun. .

Abstract

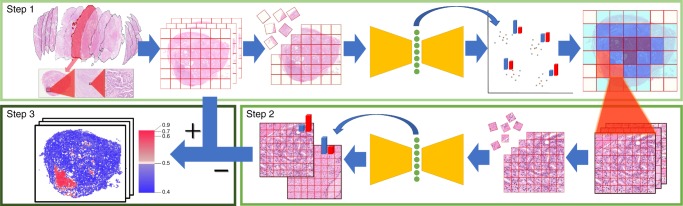
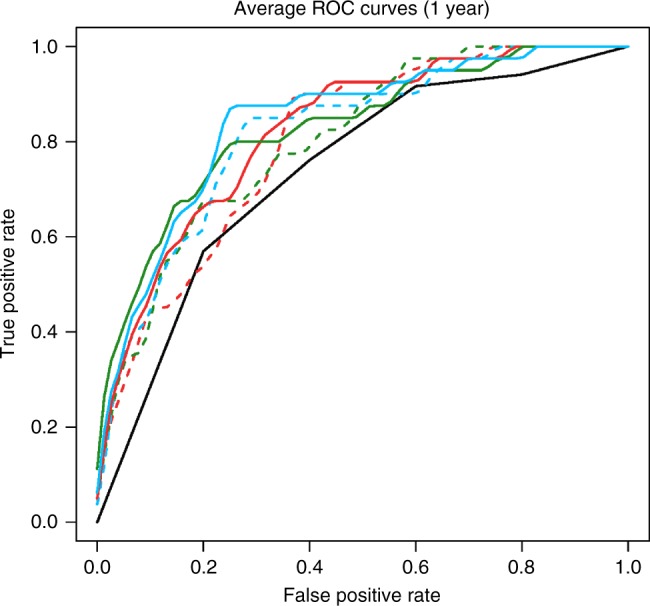
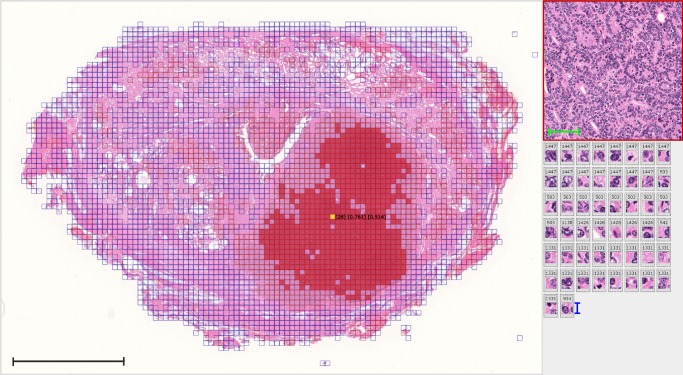
Deep learning algorithms have been successfully used in medical image classification. In the next stage, the technology of acquiring explainable knowledge from medical images is highly desired. Here we show that deep learning algorithm enables automated acquisition of explainable features from diagnostic annotation-free histopathology images. We compare the prediction accuracy of prostate cancer recurrence using our algorithm-generated features with that of diagnosis by expert pathologists using established criteria on 13,188 whole-mount pathology images consisting of over 86 billion image patches. Our method not only reveals findings established by humans but also features that have not been recognized, showing higher accuracy than human in prognostic prediction. Combining both our algorithm-generated features and human-established criteria predicts the recurrence more accurately than using either method alone. We confirm robustness of our method using external validation datasets including 2276 pathology images. This study opens up fields of machine learning analysis for discovering uncharted knowledge.


Conflict of interest statement

The authors declare no competing interests.

Figures

Fig. 1
Fig. 1. Key feature generation method.
This method is a type of dimensionality reduction that emphasizes not only the nucleus structure examined at high magnification but also the structural pattern examined at low magnification. Step 1: First, we divide low-magnification pathology images into smaller images, then perform dimensionality reduction using a deep autoencoder followed by weighted non-hierarchical clustering. This process reduces an image with 10-billion-scale pixel data to only 100 feature data with scores. Step 2: Next, we analyze high-magnification images in order to reduce the number of misclassified low-magnification images. Again, we divide these into smaller images, before applying a second deep autoencoder and calculating average scores for the images. Step 3: Results of Step 2 complementarily correct those of Step 1. We remove images in which the results of Steps 1 and 2 do not match. Finally, we use the total numbers of each type of feature to make predictions, for example, to make cancer recurrence predictions, create human-understandable features or automatically annotate images. The color of each region indicates positive (red) and negative (blue) for characteristics detected.
Fig. 2
Fig. 2. Examples of compressed images.
Whole-mount pathology images with 10-billion-scale pixel data were reduced to only 100 feature data, while retaining core image information. a Images of biochemical recurrence (BCR) cases, b images of no BCR cases. The color of each region indicates positive (red) and negative (blue) for characteristics detected.
Fig. 3
Fig. 3. Biochemical recurrence (BCR) prediction.
Average receiver operating characteristic (ROC) curves for the BCR prediction within one year. Gleason score (black solid line), Ridge (red dot line), Lasso (green dot line), support vector machine (SVM; blue dot line), Ridge + Gleason score (red solid line), Lasso + Gleason score (green solid line), SVM + Gleason score (blue solid line).
Fig. 4
Fig. 4. Representative images of key features.
The top 10 images are closest to the centroids of the 100 features, with higher-ranking images being larger, in the biochemical recurrence (BCR) group (aj) and no BCR group (kt). aj Cancers equivalent to Gleason patterns 4 or 5, which usually indicate aggressive clinical behavior. c Dense stromal components without cancer cells. g Hemorrhage. p Cancers equivalent to Gleason pattern 3, which usually indicates benign clinical behavior. koqs Loose stromal components without cancer cells. t Surgical margin without cancer cells. The scale bar included in each image represents a length of 100 μm. Expert genitourinary pathologist’s comments on BCR images (aj): Cancers show Gleason patterns 4 or 5 indicating aggressive clinical behavior. Stromal component without cancer cells tends to show dense cellularity compared to those of normal structure. The pathologist’s comments on no BCR images (kt): Cancers show Gleason pattern 3 indicating indolent clinical behavior. Stromal component without cancer cells tends to show relatively loose cellularity suggesting normal peripheral zone structure. Cauterized extraprostatic connective tissue without cancer cells, which indicate that the surgical margin is free from cancer.
Fig. 5
Fig. 5. Automatically annotated whole-mount pathology image.
Our method directly generates key features based on the whole image without requiring a region selection step. Using the key features and cell-level information found by the deep neural networks, we automatically annotated whole-mount pathology images. Here we show an automatically annotated whole-mount pathology image (left), as well as a low-magnification image of the yellow region (upper right) and the associated high-magnification images with number of Step 2 feature (lower right). The regions with impact scores above and below 0.5 in Step 1 are shaded in red and blue, respectively. The indicated yellow cell shows [number of Step 1 feature (100 total features)] [impact score, Step 1] [impact score, Step 2] (see Key feature generation method in the Methods section). The black scale bar included in the image represents a length of 1 cm. The green scale bar represents a length of 100 μm. The blue scale bar represents a length of 12.3 μm.

Comment in

References

    1. Esteva A, et al. Dermatologist-level classification of skin cancer with deep neural networks. Nature. 2017;542:115–118. doi: 10.1038/nature21056. - DOI - PMC - PubMed
    1. De Fauw J, et al. Clinically applicable deep learning for diagnosis and referral in retinal disease. Nat. Med. 2018;24:1342–1350. doi: 10.1038/s41591-018-0107-6. - DOI - PubMed
    1. Chilamkurthy S, et al. Deep learning algorithms for detection of critical findings in head CT scans: a retrospective study. Lancet. 2018;392:2388–2396. doi: 10.1016/S0140-6736(18)31645-3. - DOI - PubMed
    1. Ehteshami Bejnordi B, et al. Diagnostic assessment of deep learning algorithms for detection of lymph node metastases in women with breast cancer. JAMA. 2017;318:2199–2210. doi: 10.1001/jama.2017.14585. - DOI - PMC - PubMed
    1. Chen PHC, et al. An augmented reality microscope with real-time artificial intelligence integration for cancer diagnosis. Nat. Med. 2019;25:1453–1457. doi: 10.1038/s41591-019-0539-7. - DOI - PubMed

Publication types