. 2019 Dec 18;10(1):5765.
doi: 10.1038/s41467-019-13544-0.

Genetic correlations of psychiatric traits with body composition and glycemic traits are sex- and age-dependent

Affiliations

Genetic correlations of psychiatric traits with body composition and glycemic traits are sex- and age-dependent

Christopher Hübel et al. Nat Commun. .

Abstract

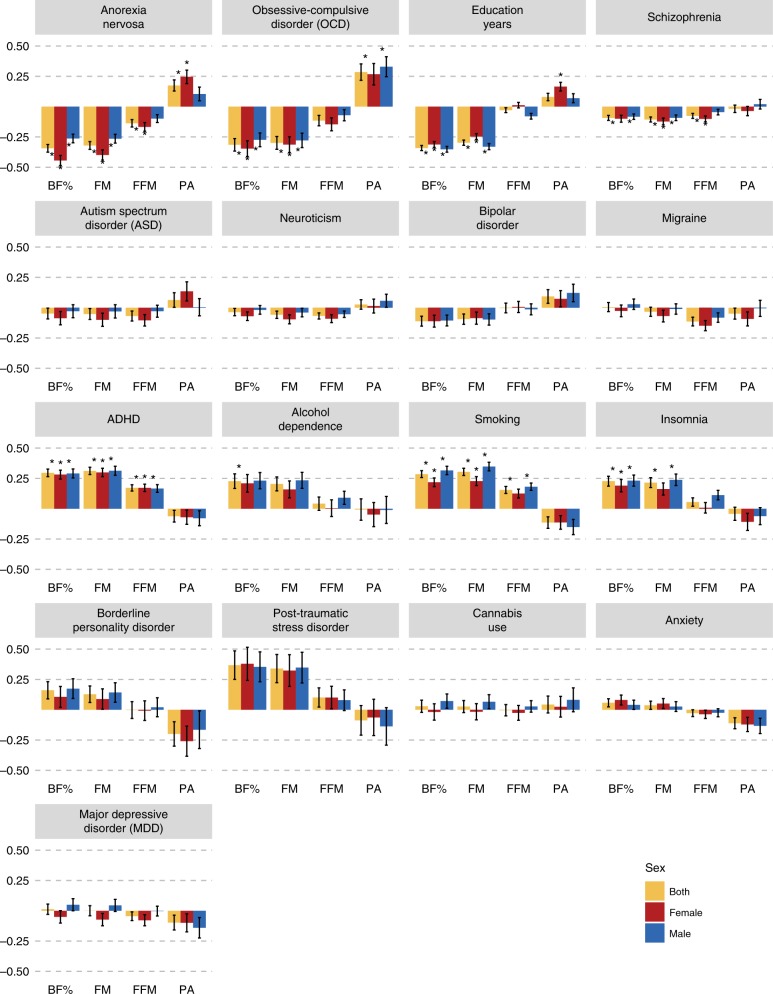
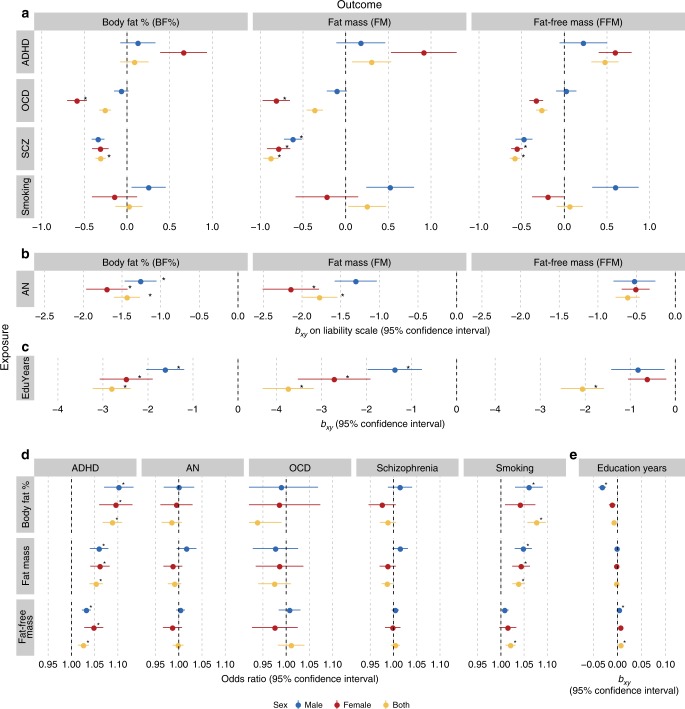
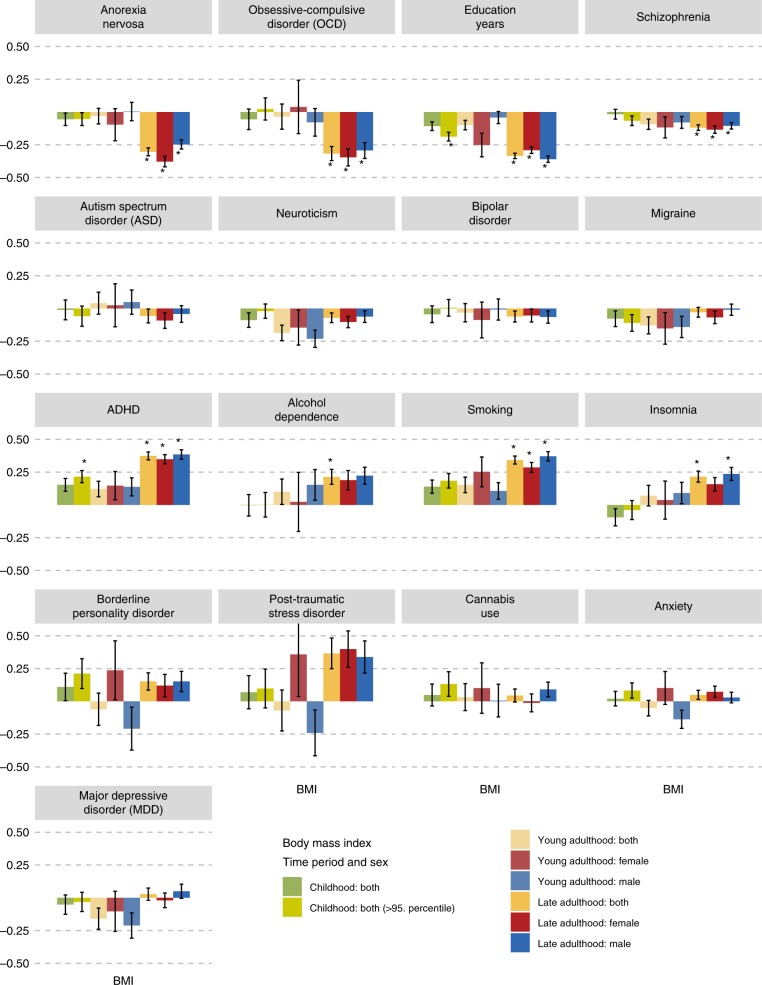
Body composition is often altered in psychiatric disorders. Using genome-wide common genetic variation data, we calculate sex-specific genetic correlations amongst body fat %, fat mass, fat-free mass, physical activity, glycemic traits and 17 psychiatric traits (up to N = 217,568). Two patterns emerge: (1) anorexia nervosa, schizophrenia, obsessive-compulsive disorder, and education years are negatively genetically correlated with body fat % and fat-free mass, whereas (2) attention-deficit/hyperactivity disorder (ADHD), alcohol dependence, insomnia, and heavy smoking are positively correlated. Anorexia nervosa shows a stronger genetic correlation with body fat % in females, whereas education years is more strongly correlated with fat mass in males. Education years and ADHD show genetic overlap with childhood obesity. Mendelian randomization identifies schizophrenia, anorexia nervosa, and higher education as causal for decreased fat mass, with higher body fat % possibly being a causal risk factor for ADHD and heavy smoking. These results suggest new possibilities for targeted preventive strategies.


Conflict of interest statement

Dr. Breen has received grant funding from and served as a consultant to Eli Lilly, has received honoraria from Illumina and has served on advisory boards for Otsuka. Dr. Bulik is a grant recipient from and has served on advisory boards for Shire. She receives royalties from Pearson. All interests are unrelated to this work. Dr. Coleman, Dr. Gaspar, Ms. Purves, Dr. Hübel, Dr. Hanscombe, Dr. Prokopenko, Dr. Graff, Dr. Ngwa, Dr. Workalemahu and Dr. O'Reilly declare no competing interests.

Figures

Fig. 1
Fig. 1. Sex-specific genetic correlations across body composition, physical activity and psychiatric traits.
Sex-specific genetic correlations of body composition traits (n = up to 155,961) and physical activity (n = up to 66,224) with sex-combined psychiatric disorders (n = up to 77,096) and behavioural traits (n = up to 157,355). The autosomal genetic correlations were calculated by bivariate linkage disequilibrium score regression (LDSC). Coloured bars represent genetic correlations, error bars depict standard errors (s.e.) and asterisks indicate statistically significant genetic correlations with p values less than α = 0.0003. This threshold was calculated via the identification of the number of independent tests using matrix decomposition of the genetic correlation matrix and subsequent Bonferroni correction of α = 0.05 for 190 independent tests. ADHD = attention-deficit/hyperactivity disorder, BF% = body fat percentage, FFM = fat-free mass, FM = fat mass, PA = physical activity.
Fig. 2
Fig. 2. Causal associations between body composition and psychiatric traits.
Results are shown from generalized summary data-based Mendelian randomization (GSMR) analyses. Colours represent the sex of the body composition trait: red for female effects, blue for male effects and yellow for sex-combined effects. Error bars represent 95% confidence intervals (95% CIs) and asterisks indicate statistically significant estimates with p values less than α = 2.6 × 10−4. a Putative causal associations of exposures (rows) psychiatric disorders (n = up to 77,096) and behavioural traits (n = up to 217,568) with outcomes (columns) body composition traits (n = up to 155,961). Dots represent the effect sizes (as measured by β, bxy) on the liability scale of the disorders or traits. b, c Mendelian randomization results for the exposures anorexia nervosa and education years on the outcomes the body composition traits. These are plotted differently due to the size of the effects. All estimates are presented together in Supplementary Fig. 1 on the same scale. d Putative causal associations of exposures (rows) body composition traits (n = up to 155,961) with outcomes (columns) psychiatric disorders (n = up to 77,096) and behavioural traits (n = up to 217,568). Dots represent the effect sizes (as measured by odds ratios, ORs) of risk factors on disorders or traits. e The Mendelian randomization results for body composition traits as exposures on the outcome years of education. Dots represent the effect sizes (as measured by β, bxy) on the scale of the risk factors. Abbreviations: ADHD = attention-deficit/hyperactivity disorder, AN = anorexia nervosa, BF% = body fat percentage, EduYears = education years, FFM = fat-free mass, FM = fat mass, OCD = obsessive compulsive disorder, SCZ = schizophrenia.
Fig. 3
Fig. 3. Sex-specific genetic correlations across glycaemic traits and psychiatric traits.
Sex-specific genetic correlations of glycaemic traits (n = up to 140,583) with sex-combined psychiatric disorders (n = up to 77,096) and behavioural traits (n = up to 157,355). The autosomal genetic correlations were calculated by bivariate linkage disequilibrium score regression (LDSC). Coloured bars represent genetic correlations, error bars depict standard errors (s.e.) and asterisks indicate statistically significant genetic correlations with p values less than α = 0.0002. This threshold was calculated via the identification of the number of independent tests using matrix decomposition of the genetic correlation matrix and subsequent Bonferroni correction of α = 0.05 for 231 independent tests. ADHD = attention-deficit/hyperactivity disorder, Glu = fasting glucose, Ins = fasting insulin, IR = insulin resistance, adj = adjusted.
Fig. 4
Fig. 4. Age-dependence of sex-specific genetic correlations across body composition and psychiatric traits.
Sex-specific genetic correlations of body mass index (BMI) and fat-free mass (n = up to 157,355) with psychiatric disorders (n = up to 77,096) and behavioural traits (n = up to 157,355) across the lifespan. Participants of the childhood BMI GWAS (green, n = 35,668) were younger than 10 years, the participants of the young adulthood GWASs (lighter colours, n = 29,054) were between 15 and 35 years, participants of the late adulthood GWAS (darker colours, n = 155,961) were between 39–75 years old. Overweight in childhood (lime green; n = 13,848) was included as an extreme phenotype. The autosomal genetic correlations were calculated by bivariate linkage disequilibrium score regression (LDSC). Coloured bars represent genetic correlations, error bars depict standard errors (s.e.) and asterisks indicate statistically significant genetic correlations with p values less than α = 0.0002. This threshold was calculated via the identification of the number of independent tests using matrix decomposition of the genetic correlation matrix and subsequent Bonferroni correction of α = 0.05 for 210 independent tests. ADHD = attention-deficit/hyperactivity disorder.

References

    1. Geschwind DH. Evolving views of human genetic variation and its relationship to neurologic and psychiatric disease. Handb. Clin. Neurol. 2018;147:37–42. - PubMed
    1. Polderman TJC, et al. Meta-analysis of the heritability of human traits based on fifty years of twin studies. Nat. Genet. 2015;47:702–709. - PubMed
    1. Schizophrenia Working Group of the Psychiatric Genomics Consortium. et al. Biological insights from 108 schizophrenia-associated genetic loci. Nature. 2014;511:421–427. - PMC - PubMed
    1. Howard DM, et al. Genome-wide meta-analysis of depression identifies 102 independent variants and highlights the importance of the prefrontal brain regions. Nat. Neurosci. 2019 doi: 10.1038/s41593-018-0326-7. - DOI - PMC - PubMed
    1. Visscher PM, et al. 10 Years of GWAS discovery: biology, function, and translation. Am. J. Hum. Genet. 2017;101:5–22. - PMC - PubMed

Publication types

MeSH terms