. 2019 Dec 18;9(1):19384.
doi: 10.1038/s41598-019-55526-8.

CETSA-based target engagement of taxanes as biomarkers for efficacy and resistance

Affiliations

CETSA-based target engagement of taxanes as biomarkers for efficacy and resistance

Anette Langebäck et al. Sci Rep. .

Abstract

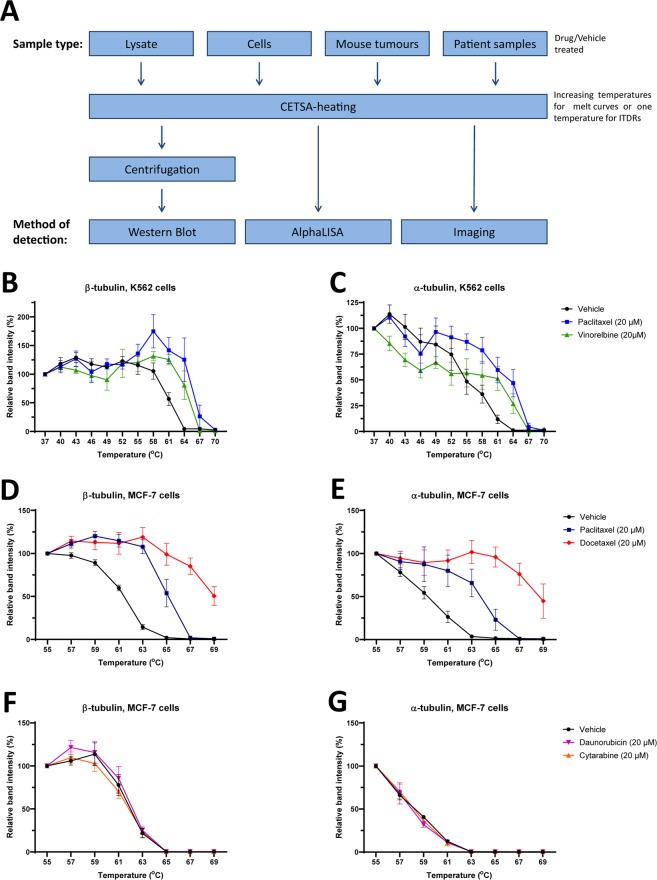
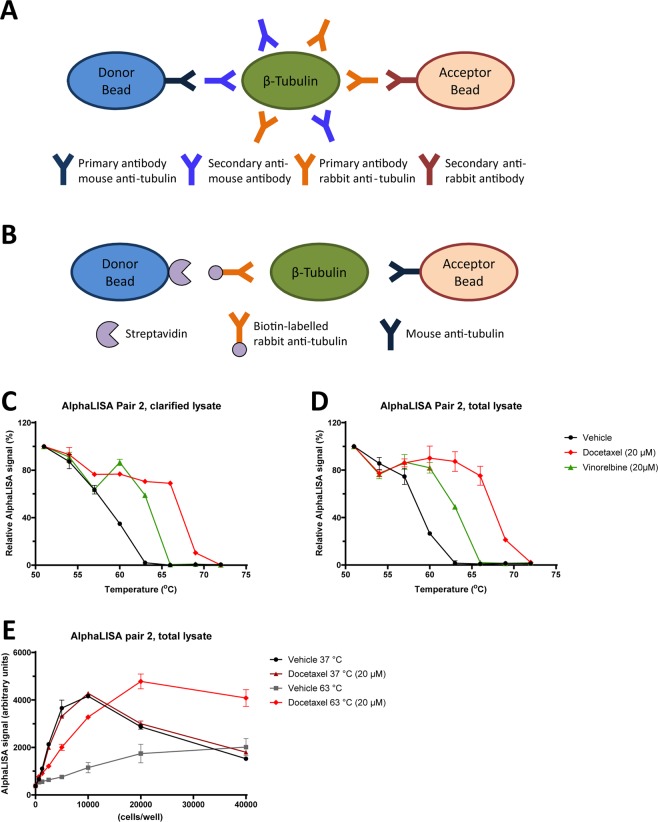
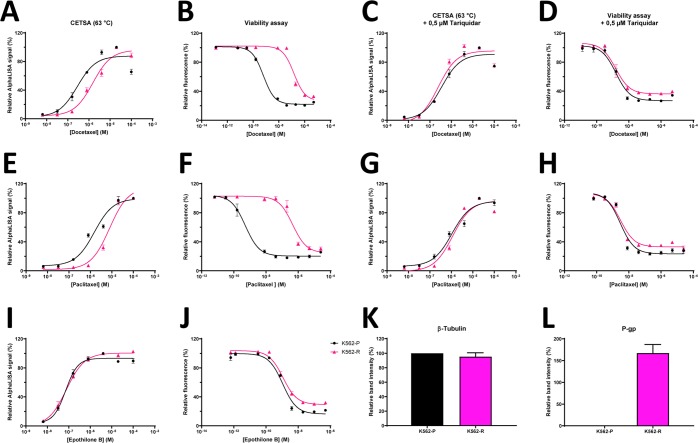
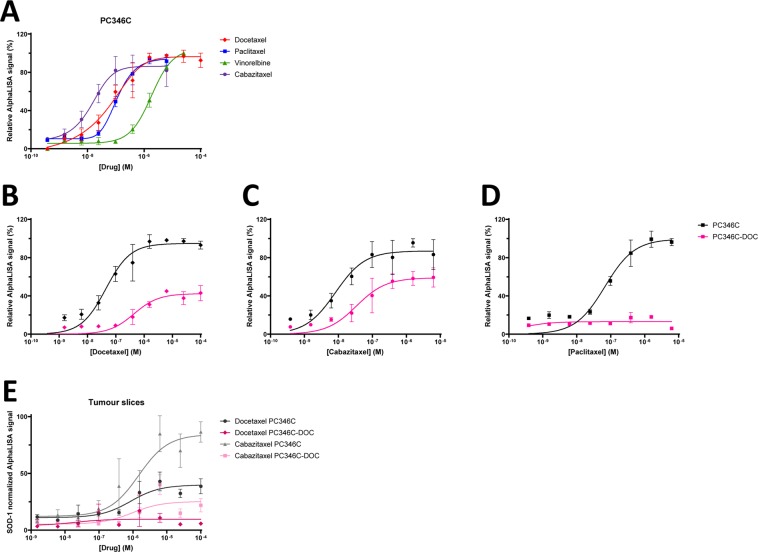
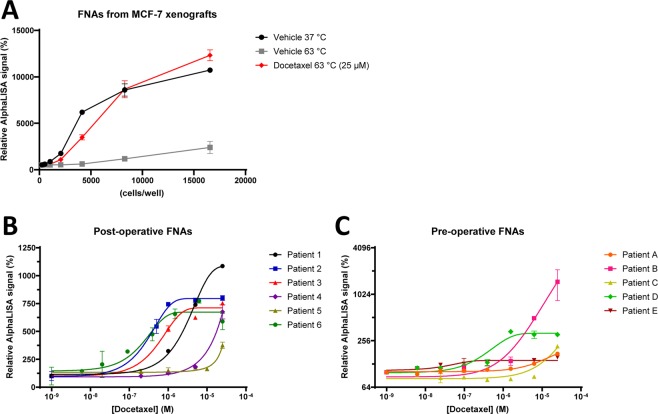
The use of taxanes has for decades been crucial for treatment of several cancers. A major limitation of these therapies is inherent or acquired drug resistance. A key to improved outcome of taxane-based therapies is to develop tools to predict and monitor drug efficacy and resistance in the clinical setting allowing for treatment and dose stratification for individual patients. To assess treatment efficacy up to the level of drug target engagement, we have established several formats of tubulin-specific Cellular Thermal Shift Assays (CETSAs). This technique was evaluated in breast and prostate cancer models and in a cohort of breast cancer patients. Here we show that taxanes induce significant CETSA shifts in cell lines as well as in animal models including patient-derived xenograft (PDX) models. Furthermore, isothermal dose response CETSA measurements allowed for drugs to be rapidly ranked according to their reported potency. Using multidrug resistant cancer cell lines and taxane-resistant PDX models we demonstrate that CETSA can identify taxane resistance up to the level of target engagement. An imaging-based CETSA format was also established, which in principle allows for taxane target engagement to be accessed in specific cell types in complex cell mixtures. Using a highly sensitive implementation of CETSA, we measured target engagement in fine needle aspirates from breast cancer patients, revealing a range of different sensitivities. Together, our data support that CETSA is a robust tool for assessing taxane target engagement in preclinical models and clinical material and therefore should be evaluated as a prognostic tool during taxane-based therapies.


Conflict of interest statement

PN is the inventor of CETSA, holder of patents related to the CETSA method, and the co-founder of Pelago Bioscience AB. All the other authors declare no competing interests.

Figures

Figure 1
Figure 1
CETSA shows distinct melt curves for α- and β-tubulin that shift upon drug binding in cancer cells. Schematic overview of the CETSA method (A). Western blot-CETSA shows that the tubulin-binding drugs paclitaxel and vinorelbine (20 µM) produce clear shifts for β-tubulin in K562-cells (B and C). In MCF-7 cells, the two taxanes, paclitaxel and docetaxel (20 µM), produce significant CETSA shifts for both β-tubulin and α-tubulin (D and E). Daunorubicin and cytarabine (negative controls) produced no shift in both β-tubulin and α-tubulin (F and G). All data represent the mean ± S.E.M from independent experiments (n = 5–6 in D and E, and n = 3 in B,C,F and G) and are presented as a percentage of the signal detected at the lowest temperature in each melt curve.
Figure 2
Figure 2
Miniaturization of the β-tubulin CETSA assay. Schematic drawing of the principle of standard and conjugated AlphaLISA (A and B). CETSA melt curves in K562 cells treated with docetaxel or vinorelbine (20 µM). β-tubulin was detected in total and clarified cell lysate with AlphaLISA pair 2 (C and D). Cell density titration for AlphaLISA pair 2 in lysate from K562 cells treated with docetaxel (20 µM) or vehicle and heated to 37 or 63 °C (E). The data represent the mean ± S.E.M from technical replicates and are presented as a percentage of the signal detected at the lowest temperature in each melt curve.
Figure 3
Figure 3
CETSA TE measurements correlate to sensitivity to taxanes and report on the mechanism of resistance. ITDR-CETSA for β-tubulin at 63 °C and viability assays in multidrug-resistant (K562-R) and the corresponding parental cells (K562-P) in response to increasing concentrations of docetaxel (AD) or paclitaxel (EH) and in the absence or presence of the Pgp-inhibitor tariquidar (C,D,G,H). ITDRs at 63 °C and viability assays performed in response to the non-Pgp-substrate epothilone B (I and J). β-tubulin was detected with AlphaLISA in the ITDR-CETSA experiments. Pgp- and β-tubulin-expression in the two cell lines was detected with western blot (K,L). ITDR-CETSA data are presented as relative to the compound concertation where maximum stabilization is achieved. Cell viability data is relative to the untreated samples. All data represent the mean ± S.E.M from independent experiments (n = 3–4).
Figure 4
Figure 4
Imaging-CETSA has the potential of quantifying TE in individual cells and report on cellular resistance. Imaging-CETSA melt curves for β-tubulin in response to docetaxel and paclitaxel (5 µM) (A). ITDR-CETSA in multidrug-resistant (K562-R) and parental (K562-P) cells after exposure to different concentrations of docetaxel (B) or paclitaxel (C) and heating at 56 °C. Representative images of K562-P and K562-R cells treated with docetaxel or vehicle (D). Hoechst staining of the nuclei is shown in blue while β-tubulin staining is shown in yellow. All data represent the mean  ±S.E.M from independent experiments (n = 3–4) and are presented as a percentage of the signal detected at the lowest temperature in each melt curve (A) or maximum stabilization detected in each series (B and C).
Figure 5
Figure 5
Docetaxel produces CETSA shifts for β-tubulin in both in vivo and ex vivo mice models. SCID-mice bearing MCF-7 xenograft tumours were treated in vivo for 30 min with docetaxel at a dose of 50 mg/kg before being sacrificed and the tumours taken for β-tubulin analysis with western blot-CETSA (A). SCID-mice bearing MCF-7 xenograft tumours were treated in vivo with different doses of docetaxel and samples were analysed with AlphaLISA (B). Pieces of MDA-MB-231 xenografts were treated ex vivo with Docetaxel (50 µM) before β-tubulin analysis with western blot-CETSA (C). All data represent the mean  ±S.E.M from different tumours in each condition (n = 2–3 in A, and n = 4 in B and C) and are presented as a percentage of the signal detected at the lowest temperature in each melt curve.
Figure 6
Figure 6
CETSA TE levels correlate with sensitivity to taxanes and reported resistance mechanisms in mouse PDX models of prostate cancer. PDX-derived cell line PC346C was treated with different concentrations of tubulin-binding drugs and β-tubulin TE was analysed with AlphaLISA (A) PC346C cells and the corresponding resistant cell line PC346C-DOC were treated with different concentrations of taxanes (BD). Tumours from the PDX model PC346C and the resistant counterpart PC346C-DOC were treated ex vivo with increasing doses of docetaxel and cabazitaxel (E). Data from tumours slices were normalized to SOD-1 levels. All data represent the mean  ±S.E.M from either different tumors in each condition (E) or from independent experiments (n = 3 in A–D).
Figure 7
Figure 7
CETSA for assessing TE for taxanes in ex vivo-treated breast cancer patient FNAs. Fine needle aspirates (FNAs) were taken from freshly removed MCF-7 xenografts and treated with docetaxel (25 µM) for 15 min before CETSA-heating at 37 or 63 °C. β-tubulin for different lysate concentrations was analysed with AlphaLISA (A). Fine needle biopsies from surgically removed tumours (B) or directly from patients (C) were treated with different concentrations of docetaxel for 15 min before CETSA-heating at 63 °C and β-tubulin analysis with AlphaLISA. The data represent the mean ± S.E.M from technical replicates and are presented as a percentage of the signal detected in the vehicle-treated samples.

References

    1. Dumontet C, Jordan MA. Microtubule-binding agents: a dynamic field of cancer therapeutics. Nat Rev Drug Discov. 2010;9:790–803. doi: 10.1038/nrd3253. - DOI - PMC - PubMed
    1. Ercolak V, Sahin B, Gunaldi M, Duman BB, Afsar CU. Efficacy of paclitaxel in the treatment of Kaposi sarcoma. Eur Rev Med Pharmacol Sci. 2015;19:4095–4100. - PubMed
    1. Prithviraj GK, et al. Carboplatin and paclitaxel as first-line treatment of unresectable or metastatic esophageal or gastric cancer. Dis Esophagus. 2015;28:782–787. doi: 10.1111/dote.12279. - DOI - PubMed
    1. Perez EA. Paclitaxel in Breast Cancer. Oncologist. 1998;3:373–389. - PubMed
    1. King KM, et al. Optimal use of taxanes in metastatic breast cancer. Curr Oncol. 2009;16:8–20. doi: 10.3747/co.v16i3.377. - DOI - PMC - PubMed

Publication types

MeSH terms