. 2019 Dec 18;10(1):5779.
doi: 10.1038/s41467-019-13593-5.

CD8+ T cell-mediated endotheliopathy is a targetable mechanism of neuro-inflammation in Susac syndrome

Affiliations

CD8+ T cell-mediated endotheliopathy is a targetable mechanism of neuro-inflammation in Susac syndrome

Catharina C Gross et al. Nat Commun. .

Abstract

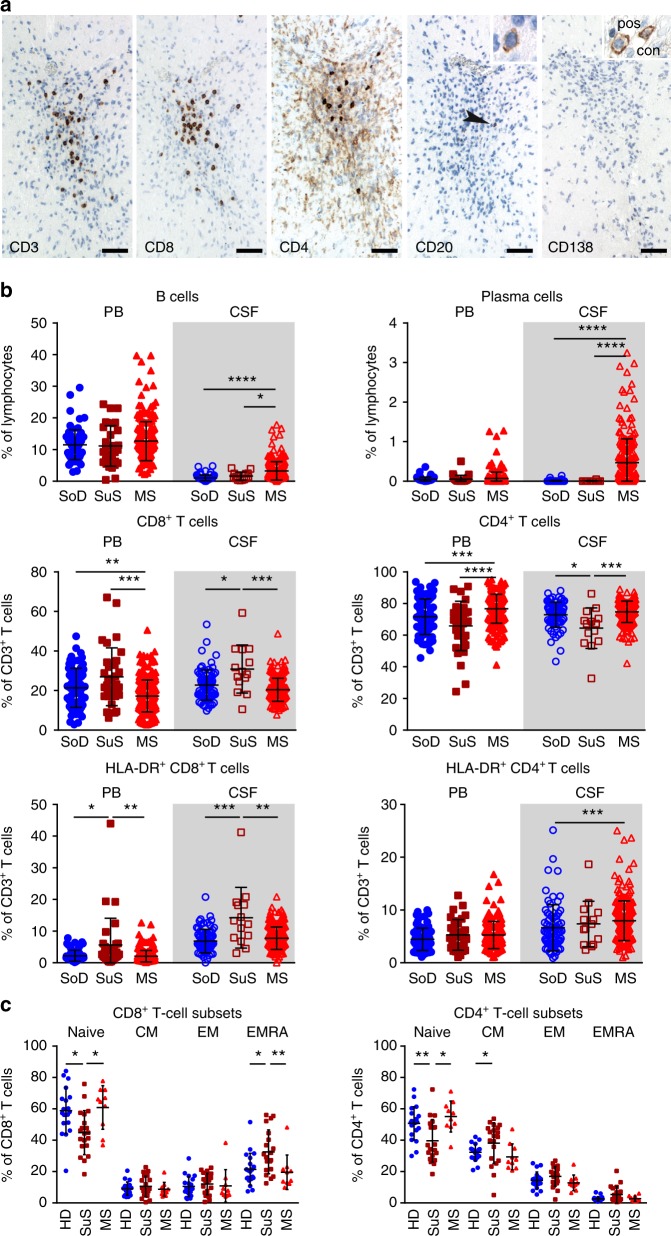
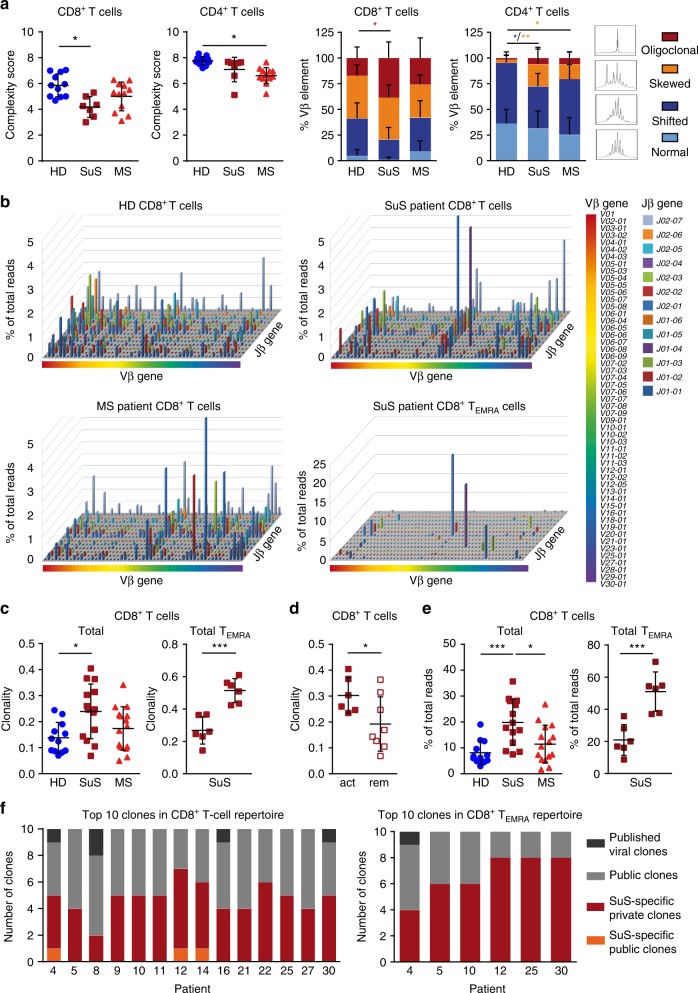
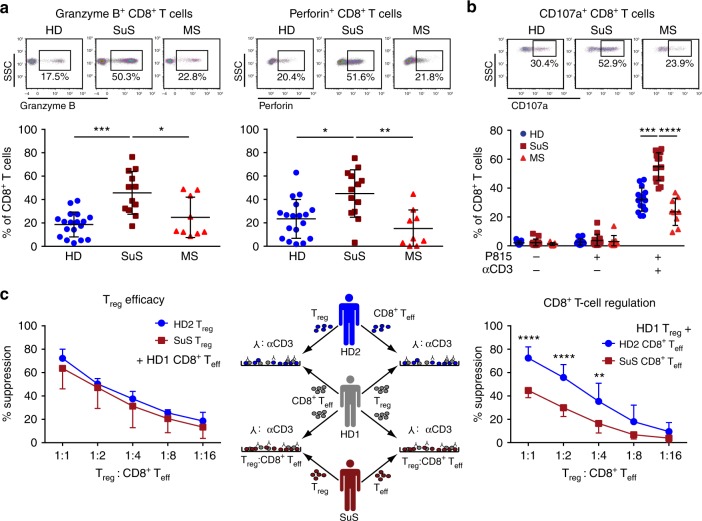
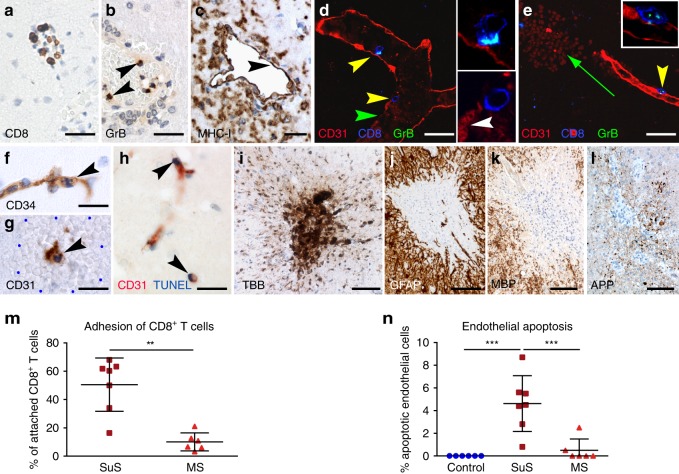
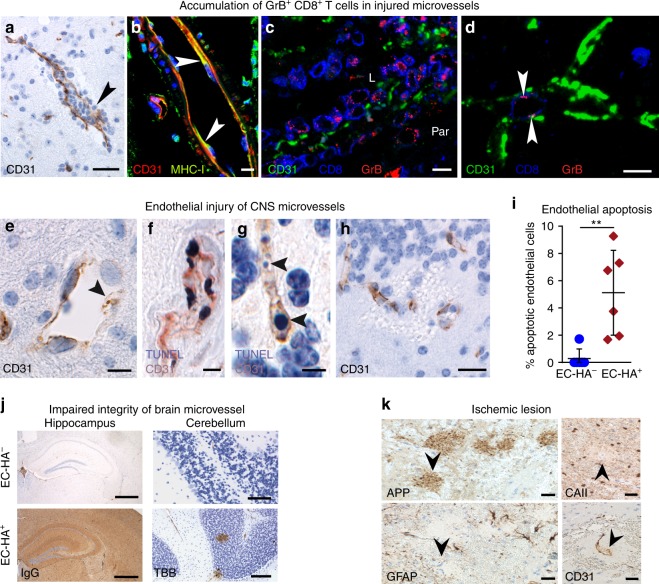
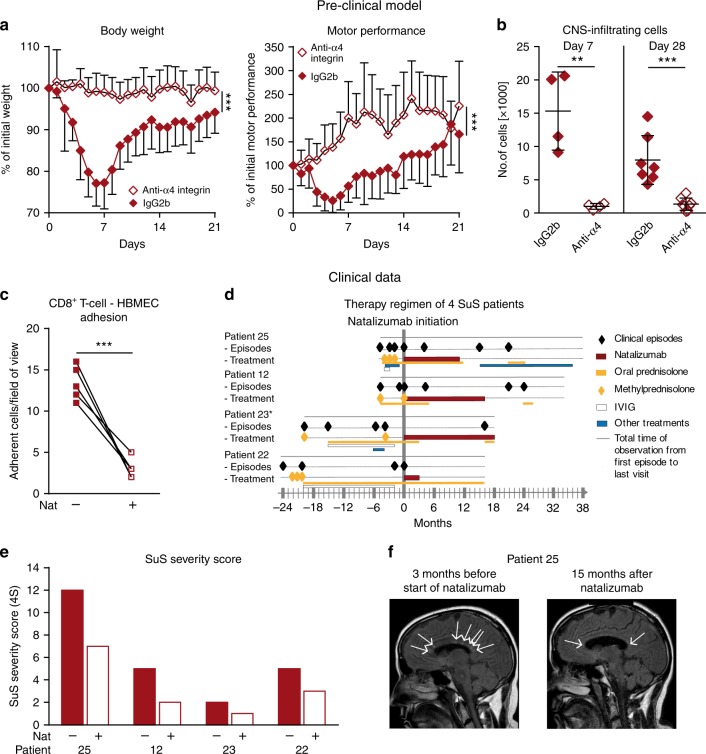
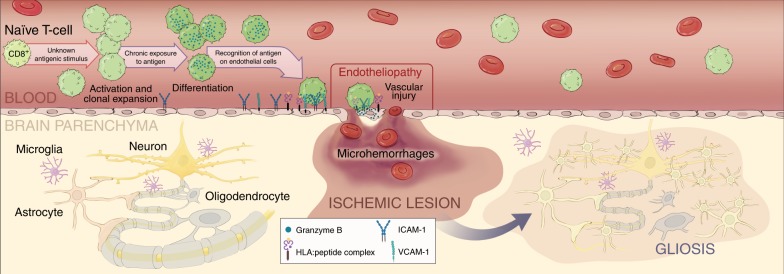
Neuroinflammation is often associated with blood-brain-barrier dysfunction, which contributes to neurological tissue damage. Here, we reveal the pathophysiology of Susac syndrome (SuS), an enigmatic neuroinflammatory disease with central nervous system (CNS) endotheliopathy. By investigating immune cells from the blood, cerebrospinal fluid, and CNS of SuS patients, we demonstrate oligoclonal expansion of terminally differentiated activated cytotoxic CD8+ T cells (CTLs). Neuropathological data derived from both SuS patients and a newly-developed transgenic mouse model recapitulating the disease indicate that CTLs adhere to CNS microvessels in distinct areas and polarize granzyme B, which most likely results in the observed endothelial cell injury and microhemorrhages. Blocking T-cell adhesion by anti-α4 integrin-intervention ameliorates the disease in the preclinical model. Similarly, disease severity decreases in four SuS patients treated with natalizumab along with other therapy. Our study identifies CD8+ T-cell-mediated endotheliopathy as a key disease mechanism in SuS and highlights therapeutic opportunities.


Conflict of interest statement

C.C.G. received speaker honoraria and travel expenses for attending meetings from Biogen, Euroimmun, Genzyme, MyLan, Novartis Pharma GmbH, and Bayer Health Care, none related to this study. Her work is funded by Biogen, Novartis, the German Ministry for Education and Research (BMBF; 01Gl1603A), the German Research Foundation (DFG, GR3946/3–1, SFB Transregio 128 A09), the European Union (Horizon2020, ReSToRE), the Interdisciplinary Center for Clinical Studies (IZKF), and the IMF. I.K. received travel expenses for attending meetings from Pfizer and CSL Behring. I.K. received speaker honoraria from Daiichi Sankyo. J.B.’s work is funded by the Austrian Science Fund (FWF: P26936-B27). A.S.-M. receives research support from Novartis. T.K. received speaker honoraria from Novartis and Excemed. Her research is supported by the DFG (SFB/Transregio 128 B07), European Leukodystrophy Association (2017-018C4A), National MS Society (RG-1801-30020), and Progressive MS Alliance (PA-1604-08492, VRAVEinMS). W.B. has received honoraria for lectures by Bayer Vital, Biogen, Merck Serono, Teva Pharma, Genzyme, Sanofi-Aventis, Novartis, Excemed, and Medday. He is a member of scientific advisory boards for Teva Pharma, Biogen, Novartis, and Genzyme. W.B. receives research support from Teva Pharma, Biogen, Genzyme, and Novartis. W.B. is supported by the Deutsche Forschungsgemeinschaft, the German Ministry for Education and Research, and by the Klaus Tschira Foundation. M.P. received speaker honoraria from Roche and Genzyme and travel/accommodation/meeting expenses from Novartis, Biogen Idec, Genzyme, and MERCK Serono. D.-A.L. received speaker honoraria from Biogen, Merck, Novartis, Roche, Teva, and Genzyme and non-personal grants from Biogen, Genzyme, Novartis, MedDay, Merck, and Roche not related to this study. J.P. is a member of scientific advisory boards from Genzyme and Novartis. He received honoraria from Biogen, Sanofi/Genzyme, and Merck Serono. M.B. received institutional support for research, speaking and/or participation in advisory boards for Biogen, Merck, Novartis, Roche, and Sanofi Genzyme. He is a consulting neurologist for RxMx/Medical Safety Systems and a research director for Sydney Neuroimaging Analysis Centre. T.A.H. has received honoraria or travel sponsorship from Bayer-Schering, Novartis, Biogen Idec, Merck-Serono, Roche, Teva, Alexion, and Sanofi-Genzyme. S.W.R. has received honoraria, travel sponsorship, research, and/or departmental support from MGANSW, MGAQLD, MAA, Lambert Initiative, Beeren foundation, anonymous donors, and from pharmaceutical/biological companies: Baxter, Bayer Schering, Biogen Idec, CSL, Genzyme, Grifols, Octapharma, Merck, Novartis, Roche, Sanofi Aventis Genzyme, Servier, and TEVA. Relevant to this study, Biogen is the manufacturer of natalizumab. S.W.R. is a shareholder of Medical Safety Systems trading as RxMx (grant and contracts with Genzyme >$25,000 AUD, contracts with Novartis, Roche, Janssen). M.R. received speaker honoraria from Novartis, Bayer Vital GmbH, and Ipsen and travel reimbursement from Bayer Schering, Biogen Idec, Merz, Genzyme, Teva, and Merck, none related to this study. J.D. received research support by Bayer and Novartis, travel support by Bayer, Novartis, Biogen, and Merck Serono, and honoraria for lectures and advisory by Bayer, Novartis, Biogen, Merck Serono, Roche, and Sanofi Genzyme. B.W. received research support from German Ministry of Education and Research, Dietmar Hopp Foundation, Klaus Tschira Foundation, Sanofi Genzyme, Merck Serono, and Novartis and speaker honoraria and/or travel support from Bayer Healthcare, Biogen, Merck Serono, Novartis, Sanofi Genzyme, and TEVA outside the submitted work. M.K. received travel support and honoraria from Bayer Schering, Biogen Idec, Chugai Pharma, Merck Serono, Novartis Pharma, Teva Pharma, and Shire Deutschland. H.L. received honoraria for lectures and consultation related to multiple sclerosis from Novartis, Roche, Sanofi Aventis, Biogen, and MEDDAY. R.H. received speaker honoraria from Euroimmun and research support from the Jubiläumsfonds der Östereichischen Nationalbank (project 16919) and the Austrian Science Fund (FWF: I3334-B27). N.S. received travel support from Novartis and Sanofi-Genzyme. L.K. received compensation for serving on scientific advisory boards for Genzyme, Merck, Novartis, and Roche; speaker honoraria and travel support from Biogen, Genzyme, Merck, Novartis, and Roche; and research support from Biogen, Genzyme, Merck, Novartis, and Roche, the German Ministry for Education and Research (BMBF), Deutsche Forschungsgesellschaft (DFG), and the Interdisciplinary Center for Clinical Studies (IZKF) Münster. S.G.M. receives honoraria for lecturing, and travel expenses for attending meetings from Almirall, Amicus Therapeutics Germany, Bayer Health Care, Biogen, Celgene, Diamed, Genzyme, MedDay Pharmaceuticals, Merck Serono, Novartis, Novo Nordisk, ONO Pharma, Roche, Sanofi-Aventis, Chugai Pharma, QuintilesIMS, and Teva. His research is funded by the German Ministry for Education and Research (BMBF), Deutsche Forschungsgesellschaft (DFG), Else Kröner Fresenius Foundation, German Academic Exchange Service, Hertie Foundation, Interdisciplinary Center for Clinical Studies (IZKF) Muenster, German Foundation Neurology and Almirall, Amicus Therapeutics Germany, Biogen, Diamed, Fresenius Medical Care, Genzyme, Merck Serono, Novartis, ONO Pharma, Roche, and Teva. G.M.-B. received speaker honoraria and travel support for attending meetings from Abbvie, Genzyme, Gilead, and Pfizer. H.W. received honoraria for scientific advisory boards/steering committees from Biogen, Evgen, MedDay Pharmaceuticals, Merck Serono, Novartis, Roche Pharma AG, and Sanofi-Genzyme. He received speaker honoraria and travel support for attending meetings from Alexion, Biogen, Cognomed, F. Hoffmann-La Roche Ltd., Gemeinnützige Hertie-Stiftung, Merck Serono, Novartis, Roche Pharma AG, Sanofi-Genzyme, TEVA, and WebMD Globa. H.W. received compensation as a consultant from Abbvie, Actelion, Biogen, IGES, Novartis, Roche, Sanofi-Genzyme, and the Swiss Multiple Sclerosis Society. He also received research support from the German Ministry for Education and Research (BMBF), Deutsche Forschungsgesellschaft (DFG), Else Kröner Fresenius Foundation, Fresenius Foundation, Hertie Foundation, NRW Ministry of Education and Research, Interdisciplinary Center for Clinical Studies (IZKF) Muenster and RE Children’s Foundation, Biogen GmbH, GlaxoSmithKline GmbH, Roche Pharma AG, and Sanofi-Genzyme. R.L. received grant support from Pierre Fabre, GlaxoSmithKline, and Diaccurate. He received speaker or scientific board honoraria from Biogen, Servier, Novartis, and Sanofi-Genzyme. R.L. is currently receiving grants from GlaxoSmithKline, Cancer Research Institute, French Cancer research foundation (ARC), Rare Diseases Foundation, and National Institute of Cancer (INCa). C.M., U.B., L.Y., A.T., S.H., T.S.-H., H.P., M.S., D.L., M.E.B., E.B., and K.D. have no financial disclosures.

Figures

Fig. 1
Fig. 1. Accumulation of activated CD8+ T cells in SuS.
a Brain lesion from a patient with SuS stained for T cell markers CD3, CD8, and CD4, B cell marker CD20, and the plasma cell marker CD138. Bars: 50 µm. Most T cells belong to the CD8+ T cell subset; light brown cells are most likely microglia cells; B cells are rare (arrowhead). One B cell is enlarged in the insert. CD138+ plasma cells are absent from this and other lesions. The insert of the CD138 staining shows plasma cells from a positive control (Rasmussen encephalitis). b Graphs representing proportions of CD19+ B cells (top left), CD138+ plasma cells (top right) among lymphocytes and CD8+ T cells (middle left), CD4+ T cells (middle right), HLA-DR+CD8+ T cells (bottom left), and HLA-DR+CD4+ T cells (bottom right) among CD3+ T cells in the peripheral blood (PB, closed symbols; SoD = 76; SuS = 32; MS = 227) and cerebrospinal fluid (CSF, open symbols; SoD = 76; SuS = 14; MS = 227) of somatoform disorders (SoD, blue circles), SuS (cayenne squares), and MS patients (red triangles up). c Quantification of naive, central memory (CM), effector memory (EM), and effector memory expressing CD45RA (EMRA) CD8+ (left) and CD4+ (right) T cell subsets in the peripheral blood of healhy donors (HD; n = 20, closed blue circles), SuS (n = 20, closed cayenne squares), and MS patients (n = 10, closed red triangles up). Statistical analysis was performed using Kruskal–Wallis test with Dunn’s post-test. Error bars indicate the mean ± s.d.; p values: *p < 0.05; **p < 0.01; ***p < 0.001; ****p < 0.0001. Source data are provided as a Source Data file.
Fig. 2
Fig. 2. Perturbations in the CD8+ TEMRA repertoire of SuS patients.
a Complexity score (left) and CDR3 length distribution (right) of peripheral CD8+ and CD4+ T cell repertoires of HD (closed blue circles, n = 11), SuS (closed cayenne squares, n = 7), and MS patients (closed red triangles up, n = 12) assessed by TCR Vβ-CDR3 spectratyping. b Representative Manhattan plots showing TCR repertoires of CD8+ T cells from a HD (top left), a SuS patient (top right, patient #10), a MS patient (bottom left), and SuS CD8+ TEMRA cells (bottom right, patient #10). The x-axis depicts all the Vβ genes, the z-axis the Jβ genes, and the column heights represent the percentage reads for each V/J gene combination. c Clonality in the CD8+ T cell repertoires of HD (closed blue circles, n = 12), SuS (closed cayenne squares, n = 14), and MS (closed red triangles up, n = 15) patients (left). Clonality in the total CD8+ T cell and CD8+ TEMRA repertoire of SuS (n = 6) patients (right). d Clonality of SuS patients with clinically active disease (closed cayenne squares, n = 6) or in clinical remission (open cayenne squares, n = 8). e Quantification of the ten most prevalent clones in the CD8+ T cell repertoires of HD (closed blue circles, n = 12), SuS (closed cayenne squares, n = 14), and MS (closed red triangles up, n = 15) patients (left), as well as in the total CD8+ T cell and CD8+ TEMRA repertoire of SuS (closed cayenne squares, n = 6) patients (right). f Graph representing the proportion of viral, public, SuS-specific public, and SuS-specific private clones in the ten most prevalent clones in the total CD8+ T cell (left) and TEMRA (right) repertoire of SuS patients. Statistical analysis was performed using Kruskal–Wallis test with Dunn’s post-test (a, c, e left graph) or unpaired Student’s t test (c right graph; d, e right graph), respectively. Error bars indicate the mean ± s.d.; p values: *p < 0.05; **p < 0.01; ***p < 0.001; ****p < 0.0001. Source data are provided as a Source Data file.
Fig. 3
Fig. 3. CTLs are more prevalent in the periphery of SuS patients.
a Representative examples (top) and quantification (bottom) of granzyme B (GrB; left) and perforin (right) expressing CD8+ T cells circulating in the blood of HD (closed blue circles, n = 18), SuS patients (closed cayenne squares, n = 13), and MS patients (closed red triangles up, n = 9). b Representative examples (top) and quantification (bottom) of CD107a-expressing CD8+ T cells from HD (closed blue circles, n = 15), SuS patients (closed cayenne squares, n = 14), and MS patients (closed red triangles up, n = 9) under the indicated conditions of re-directed lysis assay with αCD3-linked P815 cells. c Middle: Experimental set-up of allogenic suppression assays to test the suppressive capacity of regulatory T cells. Left: Graphs representing the degree of suppression of proliferation of HD CD8+ T cells upon co-culture with titrated numbers of Treg from HD (closed blue circles) and SuS (closed cayenne squares) (n = 3). Right: Graphs representing the degree of suppression of HD (closed blue circles, n = 7) and SuS patient (closed cayenne squares, n = 7) CD8+ T cell proliferation upon co-culture with titrated numbers of independent HD Treg. Statistical analysis was performed using Kruskal–Wallis test with Dunn’s post-test (a, b) or two-way ANOVA with Bonferroni post-test (c), respectively. Error bars indicate the mean ± s.d.; p values: *p < 0.05; **p < 0.01; ***p < 0.001; ****p < 0.0001. Source data are provided as a Source Data file.
Fig. 4
Fig. 4. CTLs accumulate in damaged microvessels of SuS patients CNS biopsies of SuS patients (n = 7).
a Accumulation of CD8+ T cells (brown) in a brain microvessel. b GrB+ cells in a brain microvessel; arrowheads indicate GrB+ cells attached to the vessel wall. c MHC class-I expression on ECs (arrowhead). Several leukocytes adhere to the endothelium. d Yellow arrowheads point to CD8+ T cells (blue) attached to CD31+ ECs (red). The enlargement of the upper CD8+ T cell shows its GrB+ (green) granules polarized toward the ECs. Owing to close proximity of the green GrB+ granules to the blue CD8+ cell membrane, these granules have a cyan blue color. The lower CD8+ T cell is migrating through the damaged (white arrowhead) vessel wall. e The same triple staining for GrB (green), CD8 (blue), and CD31 (red) shows a cytotoxic T cell attached to an intact vessel wall (yellow arrowhead). The upper left corner shows a microhemorrhage (green arrow) with parenchymal erythrocytes. f An apoptotic CD31+ EC with a condensed nucleus (arrowhead) within a microhemorrhage. g Staining for CD34 shows an EC with an apoptotic condensed (arrowhead) nucleus within a microhemorrhage encircled by the blue dots. h TUNEL-positive nuclei (arrowheads) of CD31+ ECs. i Turnbull blue (TBB) shows iron deposition around a blood vessel. jl Small ischemic lesion combining loss of GFAP+ astrocytes, MBP+ myelin, and axonal damage shown by APP+ spheroids. m Proportions of CD8+ T cells in contact with ECs in brain specimen of SuS (cayenne squares, n = 7) and MS patients (red triangles up, n = 6). n Quantification of CD34+ endothelial apoptosis in brain specimen derived from non-inflammatory controls (blue circles, n = 6), SuS (cayenne squares, n = 7), and MS patients (red triangles up, n = 6). Scale bars: 20 µm (a, b, fi), 25 µm (ce), 200 µm (j, l). Statistical analysis was performed using Mann–Whitney test (m) or one-way ANOVA with Bonferroni post-test (n), respectively. Error bars indicate the mean ± s.d.; p values: **p < 0.01; ***p < 0.001. Source data are provided as a Source Data file.
Fig. 5
Fig. 5. EC-HA+ mice as an in vivo model for CTL-mediated endotheliopathy.
a Investigation of T cell CNS infiltration in the brain, retina, and inner ear of EC-HA or EC-HA+ recipient mice on day 7 after adoptive transfer. Left: Representative histological sections documenting T cell infiltration (CD3+, brown). Right: Quantification of tissue-infiltrating T cells in EC-HA (closed blue circles) or EC-HA+ (closed cayenne diamonds) recipient mice (n = 4–8 per group); data for retina and inner ear originate from 2 independent experiments, involving transfer of cytotoxic CD8+ T cells alone or with control IgG. b Quantification of the cytolytic activity of CNS-infiltrating T cells analyzed as CD107a expression on day 7 after adoptive transfer in CD45.2+ EC-HA (closed blue circles) or EC-HA+ recipient mice (closed cayenne diamonds) (n = 7–8 per group, 2 independent experiments). c Weight loss (left; 11–12 mice per group) and rotarod motor performance (right; 7–8 mice per group) following adoptive transfer of HA-specific CTLs in EC-HA (closed blue circles) or EC-HA+ (closed cayenne diamonds) mice. Data are from three (body weight) or two (motor performance) independent experiments. Statistical analysis was using the unpaired Student’s t test (a, b) or two-way ANOVA with Bonferroni post-test (c), respectively. Error bars indicate the mean ± s.d.; p values: *p < 0.05; **p < 0.01; ***p < 0.001; ****p < 0.0001. Source data are provided as a Source Data file.
Fig. 6
Fig. 6. CTLs accumulate in damaged microvessels of EC-HA+ mice.
Representative brain images of EC-HA+ mice 4 days after adoptive transfer of cytotoxic CD8+ T cells (n = 6). a Accumulation of leukocytes in CNS microvessels. b Expression of MHC class-I molecules (green) on CD31+ (red) ECs; nuclei marked with TO-PRO-3 (blue). c Presence of GrB+ (red) CD8+ (blue) T cells in vessel lumen (L) of a battered CD31+ (green) blood vessel. Par parenchyma d GrB+ granules (red, arrowheads) CD8+ cells (blue) in close contact with the lumen of a small CD31+ blood vessel (green). e Representative image exhibiting CD31+ (brown) endothelium loss (arrowheads) in CNS microvessels of EC-HA+ mice following CD8+ T cell transfer. f Apoptosis and g DNA fragmentation (arrowheads) of CD31+ ECs (brown) detected with TUNEL staining (black). h Microhemorrhages in close proximity to destroyed vessels. Scale bars 10 µm. i Percentage of endothelial apoptosis assessed condensed nuclei in CD34+ endothelial cells (74–206 cells per mouse) of EC-HA (closed blue circles) or EC-HA+ mice (closed cayenne diamonds) (n = 6 per group). Scale bars 100 µm. Statistical analysis was performed by unpaired Student’s t test. Error bars indicate the mean ± s.d. p value: **p < 0.01. Source data are provided as a Source Data file. j Deposition of IgG in the hippocampus and turnbull blue staining (TBB) of the cerebellum of EC-HA and EC-HA+ mice after CTL transfer. Scale bars 500 µm. Data from two independent experiments, 5–6 mice per genotype are shown. k Representative small ischemic lesion in and above the corpus callosum at day 7 post-transfer in an EC-HA+ mouse. APP labeling (arrowhead) reveals axonal damage. Focal loss of astrocytes is visualized by the absence of GFAP (arrowhead). Detection of carbonic anhydrase II (CAII) reveals the focal loss of oligodendrocytes (arrowhead). The CD31 staining shows loss of ECs (arrowhead). Nuclear counterstaining was performed with hematoxylin (blue) (n = 6 per group).
Fig. 7
Fig. 7. Effects of anti-VLA4 mAb in a preclinical and clinical setting.
a, b Preclinical data. a EC-HA+ mice received HA-specific cytotoxic CD8+ T cells and were treated every 4 days with the anti-mouse α4 integrin mAb (PS/2; open cayenne diamonds) or with an isotype control mAb (IgG2b; closed cayenne diamonds) from day 0 onwards. Clinical signs including weight loss (left) and rotarod performance (right) were assessed daily. The data are from 2 independent experiments involving 10–11/mice per group. b Absolute numbers of transferred (Thy1.2+CD45.1+) T cells infiltrating within the CNS of EC-HA+ mice (n = 4–8/group) 7 and 28 days after treatment with a control IgG2b (closed cayenne diamonds) or the anti-α4 integrin mAb (open cayenne diamonds). cf Clinical data. c Quantification of unstimulated SuS CD8+ T cells (n = 7) adhering to HBMEC monolayer under flow conditions in the absence (closed cayenne squares) or presence (open cayenne squares) of the anti-human α4 integrin mAb natalizumab. Error bars indicate the mean ± SD. d Clinical episodes (closed black diamonds) of 4 SuS patients receiving treatments with 300 mg natalizumab monthly (cayenne line), oral prednisolone, tapered from 1 mg/kg body weight (yellow line), pulses of methylprednisolone, 1 g for 5 days (closed yellow diamonds), monthly IVIg 0.4 mg/kg body weight for 5 days (open white line), or other treatments, including cyclophosphamide, plasma exchange, mycophenolate mofetil, and azathioprine (blue line). *Patient 23 is still under treatment with natalizumab, while patients 25, 12, and 22 are not. e Bar graph representing the disease score of the four SuS patients before and during treatment with natalizumab. f Detection of CNS lesions (arrows) with sagittal FLAIR MRI sequence in patient 25 before (left) and 15 months after the beginning of natalizumab treatment (right). Statistical analysis was performed using unpaired (b), paired Student’s t test (c), or two-way ANOVA with Bonferroni post-test (a), respectively. Error bars indicate the mean ± s.d. p values: **p < 0.01; ***p < 0.001. Source data are provided as a Source Data file.
Fig. 8
Fig. 8. Role of CD8+ T cells in the pathophysiology of SuS.
Working model of role of CD8+ T cells in the pathophysiology of SuS. A yet unknown antigenic stimulus drives activation, clonal expansion, and differentiation of CD8+ T cells into GrB- and perforin-expressing CD8+ TEMRA cells. CD8+ T cells accumulate in microvessels of the brain, retina, and inner ear, where they adhere to the endothelium, recognize HLA:peptide complex(es), polarize their cytolytic vesicles toward the endothelial plasma cell membrane, and induce apoptosis of ECs, most likely in a perforin/GrB-dependent manner. Death of ECs and focal disruption of the blood–brain barrier result in microhemorrhages, whereas occlusion of small blood vessels leads to small ischemic lesions with loss of astrocytes, oligodendrocytes, neurons, and axons. Finally, ischemic lesions become gliotic by infiltration of surrounding astrocytes. Illustration©2019-Heike Blum, Department of Neurology with Institute of Translational Neurology, University Hospital Münster.

References

    1. Engelhardt B, Vajkoczy P, Weller RO. The movers and shapers in immune privilege of the CNS. Nat. Immunol. 2017;18:123–131. doi: 10.1038/ni.3666. - DOI - PubMed
    1. Obermeier B, Verma A, Ransohoff RM. The blood-brain barrier. Handb. Clin. Neurol. 2016;133:39–59. doi: 10.1016/B978-0-444-63432-0.00003-7. - DOI - PubMed
    1. Zhao Z, Nelson AR, Betsholtz C, Zlokovic BV. Establishment and dysfunction of the blood-brain barrier. Cell. 2015;163:1064–1078. doi: 10.1016/j.cell.2015.10.067. - DOI - PMC - PubMed
    1. Ajami B, et al. Single-cell mass cytometry reveals distinct populations of brain myeloid cells in mouse neuroinflammation and neurodegeneration models. Nat. Neurosci. 2018;21:541–551. doi: 10.1038/s41593-018-0100-x. - DOI - PMC - PubMed
    1. Alvarez JI, et al. Focal disturbances in the blood-brain barrier are associated with formation of neuroinflammatory lesions. Neurobiol. Dis. 2015;74:14–24. doi: 10.1016/j.nbd.2014.09.016. - DOI - PubMed

Publication types

MeSH terms