. 2019 Dec 18;9(1):19395.
doi: 10.1038/s41598-019-55887-0.

Outcome contingency selectively affects the neural coding of outcomes but not of tasks

Affiliations

Outcome contingency selectively affects the neural coding of outcomes but not of tasks

David Wisniewski et al. Sci Rep. .

Abstract

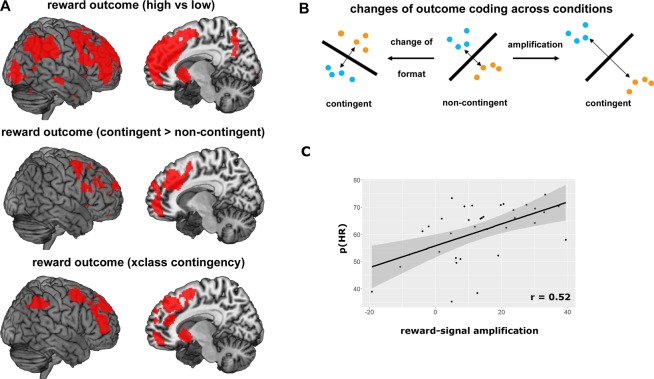
Value-based decision-making is ubiquitous in every-day life, and critically depends on the contingency between choices and their outcomes. Only if outcomes are contingent on our choices can we make meaningful value-based decisions. Here, we investigate the effect of outcome contingency on the neural coding of rewards and tasks. Participants performed a reversal-learning paradigm in which reward outcomes were contingent on trial-by-trial choices, and performed a 'free choice' paradigm in which rewards were random and not contingent on choices. We hypothesized that contingent outcomes enhance the neural coding of rewards and tasks, which was tested using multivariate pattern analysis of fMRI data. Reward outcomes were encoded in a large network including the striatum, dmPFC and parietal cortex, and these representations were indeed amplified for contingent rewards. Tasks were encoded in the dmPFC at the time of decision-making, and in parietal cortex in a subsequent maintenance phase. We found no evidence for contingency-dependent modulations of task signals, demonstrating highly similar coding across contingency conditions. Our findings suggest selective effects of contingency on reward coding only, and further highlight the role of dmPFC and parietal cortex in value-based decision-making, as these were the only regions strongly involved in both reward and task coding.


Conflict of interest statement

The authors declare no competing interests.

Figures

Figure 1
Figure 1
Experimental paradigm. (A) Trial structure. Each trial started with the cue ‘choose’ presented on screen, indicating that subjects should now decide which of the two SR mappings (mapping X or mapping Y) to perform in that trial. After a variable delay, the task screen was presented for a fixed duration, and participants implemented the chosen task. Reward feedback was presented subsequently after each trial (high reward = 1€, low reward = 10€cents, no reward). All trials were separated by variable inter-trial-intervals. (B) Tasks. Subjects were instructed to identify the category of a visual object presented on screen (means of transportation, furniture, musical instruments). Each category was associated with a colored button, and subjects were instructed to press the corresponding button. Two different sets of stimulus-response mappings were learned, and labelled mapping X and mapping Y. On each trial, subjects had the free choice which of the two mappings to implement. (C) Reward conditions. In contingent trials, subjects performed a probabilistic reversal-learning paradigm. In each trial, one of the two mappings yielded a high reward with a high probability (80%), and a low reward with a low probability (20%). The other task had the opposite reward contingencies. Which task yielded higher rewards depended on the current reward contingency, which changed across the experiment. In non-contingent trials, subjects also received high and low reward outcomes, which were assigned randomly (50%/50%) and were not contingent on specific task choices.
Figure 2
Figure 2
Behavioral Results. (A) Reaction Times (RT). The box plots depict reaction times for each combination of stimulus-response mapping and reward condition. Contingent (CR) trials are shown in dark grey, non-contingent (NCR) trials are shown in light grey. (B) Switch probabilities. Probability to switch away from the current task as a function of previous reward (high = HR dark grey, low = LR light grey), separately for contingent (CR) and non-contingent (NCR) trials. (C) Probability to choose the high reward task in CR trials (p(HR)), as a function of how many trials passed since the last reward contingency switch. Participants chose below chance (50%) on trials immediately following a contingency switch (‘perseveration’), and then quickly switched to choosing the HR task on subsequent trials. All error bars depict the SEM.
Figure 3
Figure 3
Reward-related brain activity. (A) Multivariate decoding of reward outcome value. Above: baseline decoding. Depicted are regions that encoded the value of reward outcomes (high vs. low, combined across CR and NCR trials). The regions identified were used as masks for the following analyses. Results are displayed at p < 0.05 (FWE corrected). Middle: regions showing stronger outcome coding in contingent (CR) than in non-contingent (NCR) trials. Below: regions encoding reward values using similar formats in both contingency conditions, as tested using a cross-classification (xclass) analysis. (B) Amplification vs change of format of neural coding. Most regions identified in A showed both stronger decoding in CR trials, and similar formats across both contingency conditions. This is compatible with an amplification or gain increase of neural codes. In the middle, a hypothetical example of a pattern decoding is depicted. High reward trials are depicted as blue, low reward trials as orange dots. The classifier fits a decision boundary to separate the two distributions. If this code changes between the two contingency conditions (left), decoding might still be possible at similar accuracy levels as before, but a classifier trained on NCR trials will be unsuccessful in classifying CR trials. If this code is amplified in the CR condition however (right), the same patterns become more easily separable. The same classifier will be will be successful in both conditions and accuracies will increase. See for more information. (C) Correlation of reward signal amplification and successful performance. This plot shows the correlation between the degree of reward signal amplification (accuracy in CR trials – accuracy in NCR trials), and successful performance in CR trials (probability to choose the high reward task, p(HR)). Each dot is one subject, and the line depicts a fitted linear function with 95% confidence intervals (gray area).
Figure 4
Figure 4
Task coding. (A) Task coding during maintenance. Results from the baseline decoding analysis are depicted above. Two clusters passed the significance threshold (p < 0.001 uncorrected at the voxel level, p < 0.05 FWE corrected at the cluster level), one in the parietal cortex, and one in the right anterior MFG. Accuracies were then extracted for the contingent (CR), non-contingent (NCR), and contingency cross-classification (xclass) task decoding analyses. Results can be seen in the boxplots. Above the plots, Bayes factors (BF10) of a t-test vs. chance level are shown. BF10 for the baseline analysis is not reported, as this analysis was used to define the ROIs, and running additional statistical tests on this data would constitute double dipping. (B) Task coding at the time of decision-making. Above, the dmPFC ROI used in this analysis (from) is depicted. The box plot depicts results from our data in this ROI, for all four analyses performed (baseline, CR, NCR, xclass). The dissociation plot depicts a double dissociation between two ROIs (right dmPFC, as defined using data from, and the left parietal cortex, as defined using data from), and two time points in the trial (time of decision-making, maintenance). All error bars represent SEM. (C) Overlap with previous results. Results from the current study (red) are overlain on previous findings from (blue), and (green). All results are based on task decoding analyses (searchlight decoding, radius = 3 voxels, C = 1, chance level = 50%), albeit with different specific tasks being contrasted in each study. Despite this fact, all three studies find task information around the intraparietal sulcus. Findings in the PFC are less consistent.

References

    1. Domenech P, Redouté J, Koechlin E, Dreher J-C. The Neuro-Computational Architecture of Value-Based Selection in the Human Brain. Cereb. Cortex. 2018;28:585–601. - PubMed
    1. Rubinstein JS, Meyer DE, Evans JE. Executive control of cognitive processes in task switching. J. Exp. Psychol. Hum. Percept. Perform. 2001;27:763–797. doi: 10.1037/0096-1523.27.4.763. - DOI - PubMed
    1. Collins AGE, Ciullo B, Frank MJ, Badre D. Working Memory Load Strengthens Reward Prediction Errors. J. Neurosci. 2017;37:4332–4342. doi: 10.1523/JNEUROSCI.2700-16.2017. - DOI - PMC - PubMed
    1. Daw ND, Gershman SJ, Seymour B, Dayan P, Dolan RJ. Model-Based Influences on Humans’ Choices and Striatal Prediction Errors. Neuron. 2011;69:1204–1215. doi: 10.1016/j.neuron.2011.02.027. - DOI - PMC - PubMed
    1. Matsumoto M, Matsumoto K, Abe H, Tanaka K. Medial prefrontal cell activity signaling prediction errors of action values. Nat. Neurosci. 2007;10:647–656. doi: 10.1038/nn1890. - DOI - PubMed

Publication types