. 2020 Jan;15(1):15-39.
doi: 10.1038/s41596-019-0232-9. Epub 2019 Dec 18.

Tumor organoid-T-cell coculture systems

Affiliations

Tumor organoid-T-cell coculture systems

Chiara M Cattaneo et al. Nat Protoc. 2020 Jan.

Abstract

T cells are key players in cancer immunotherapy, but strategies to expand tumor-reactive cells and study their interactions with tumor cells at the level of an individual patient are limited. Here we describe the generation and functional assessment of tumor-reactive T cells based on cocultures of tumor organoids and autologous peripheral blood lymphocytes. The procedure consists of an initial coculture of 2 weeks, in which tumor-reactive T cells are first expanded in the presence of (IFNγ-stimulated) autologous tumor cells. Subsequently, T cells are evaluated for their capacity to carry out effector functions (IFNγ secretion and degranulation) after recognition of tumor cells, and their capacity to kill tumor organoids. This strategy is unique in its use of peripheral blood as a source of tumor-reactive T cells in an antigen-agnostic manner. In 2 weeks, tumor-reactive CD8+ T-cell populations can be obtained from ~33-50% of samples from patients with non-small-cell lung cancer (NSCLC) and microsatellite-instable colorectal cancer (CRC). This enables the establishment of ex vivo test systems for T-cell-based immunotherapy at the level of the individual patient.


Conflict of interest statement

Competing financial interests

There are no competing financial interests to report.

Figures

Figure 1
Figure 1. Overview of the procedure.
(a) Tumor organoids are established from tumor tissue and PBMC are isolated from peripheral blood prior to start of co-culture. Organoids are isolated from Geltrex 2 days prior to co-culture and stimulated with IFNγ 1 day prior to co-culture. On the day of co-culture, organoids are dissociated to single cells and plated together with PBMC on an anti-CD28-coated plate, in the presence of IL-2 and anti-PD-1. After 1 week of co-culture, PBMC are re-stimulated with tumor cells. After 2 weeks of co-culture with autologous tumor organoids (pink), T cells can be cryopreserved (yellow), T cell reactivity against tumor cells is evaluated (green), or a tumor organoid killing assay is performed (blue). (b) Time from start of organoid culture to establishment of a frozen biobank. (c) Passage number of organoids at time of freezing. (d) Percentage CD3+ T cells in PBMC after two weeks of co-culture. Horizontal bars in (b) and (c) indicate average, error bar s.e.m. Each symbol is an organoid culture from a separate tumor. NSCLC biopsy: n = 11; NSCLC resection: n = 13; CRC biopsy: n = 15; CRC resection: n = 25.
Figure 2
Figure 2
Examples of flow cytometry plots showing tumor reactivity of CD8+ T cells. After two weeks of co-culture, T cells were restimulated with tumor organoids as described in step 81B or 81C of this protocol. Intracellular IFNγ and cell surface CD107a (a) or CD137 (b) are used as a read-out of reactivity. Gating strategy is shown.
Figure 3
Figure 3
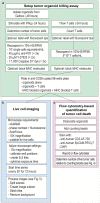
Killing experiment overview. Experimental set up is described in (a). Flow cytometry-based quantification of the amount of alive tumor organoids is described in (b). Live imaging set up and processing is described in (c).
Figure 4
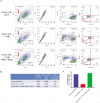
Figure 4. Quantification of the tumor organoid killing assay.
(a) Examples of flow cytometry plots showing tumor cells after 72 hours incubation with or without previously obtained autologous T cell populations, in the presence or absence of MHC-I blocking antibodies. The number of live tumor cells, defined as EpCAM+, DAPI- and NucView488-, is evaluated. Gating strategy is shown. (b) The absolute count of events in the “Alive cells” gate is divided by the number of events in the “Counting beads” gate (red box in (a)). (c) Bar graph of the number of live cells, normalized to counting beads.
Figure 5
Figure 5
Example of processing of live imaging data. After tiles have been fused with the stitching fuction of ZenPro (a), an image subset containing the region of interest is created (b). Background is then removed from each channel (c) and a merged composite picture is created (d). Red = mCherry-labelled tumor organoids. Green = NucView488 Caspase 3/7 dye. In this example, T cells are surrounding mCherry+ tumor organoids, associated with tumor organoid dissociation, release of debris and NucView488+ apoptotic cells. Scale bar = 100 μm.

References

    1. Blank CU, Haanen JB, Ribas A, Schumacher TN. The “cancer immunogram”. Science. 2016;352:658–660. - PubMed
    1. Dijkstra KK, Voabil P, Schumacher TN, Voest EE. Genomics- and transcriptomics-based patient selection for cancer treatment with immune checkpoint inhibitors: a review. JAMA Oncol. 2016;2:1490–1495. - PubMed
    1. Pitt JM, et al. Resistance mechanisms to immune-checkpoint blockade in cancer: tumor-intrinsic and –extrinsic factors. Immunity. 2016;44:1255–1269. - PubMed
    1. Sharma P, Hu-Lieskovan S, Wargo JA, Ribas A. Primary, adaptive, and acquired resistance to cancer immunotherapy. Cell. 2017;168:707–723. - PMC - PubMed
    1. Turcotte S, et al. Phenotype and function of T cells infiltrating visceral metastases from gastrointestinal cancers and melanoma: implications for adoptive cell transfer therapy. J Immunol. 2013;191:2217–2225. - PMC - PubMed

Publication types