. 2020 Jan;577(7788):115-120.
doi: 10.1038/s41586-019-1847-2. Epub 2019 Dec 18.

Metabolic heterogeneity confers differences in melanoma metastatic potential

Affiliations

Metabolic heterogeneity confers differences in melanoma metastatic potential

Alpaslan Tasdogan et al. Nature. 2020 Jan.

Abstract

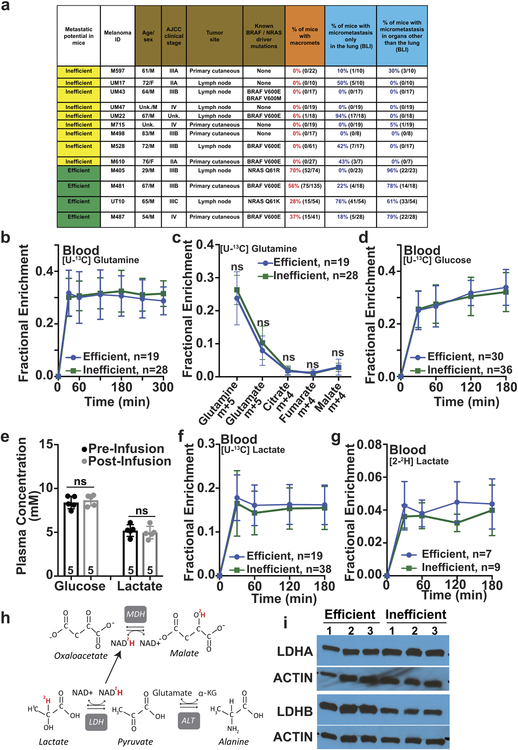
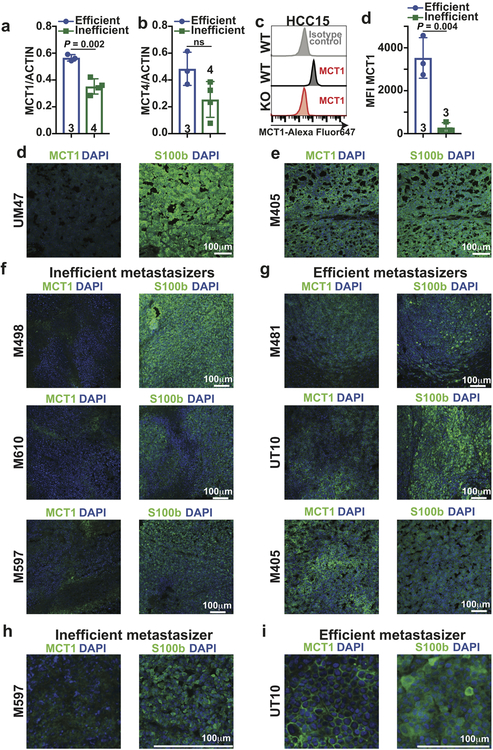
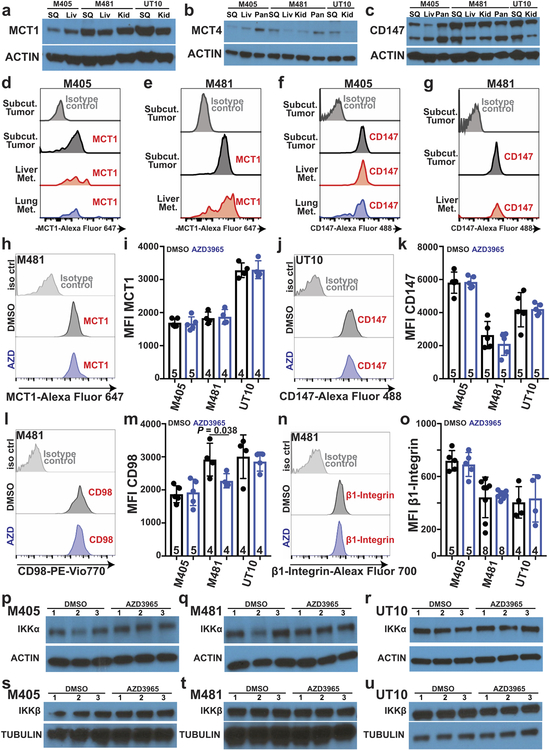
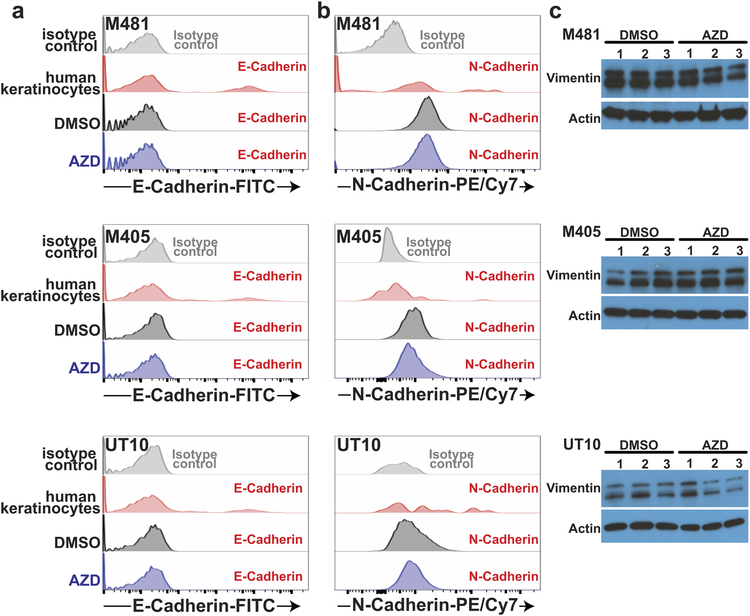
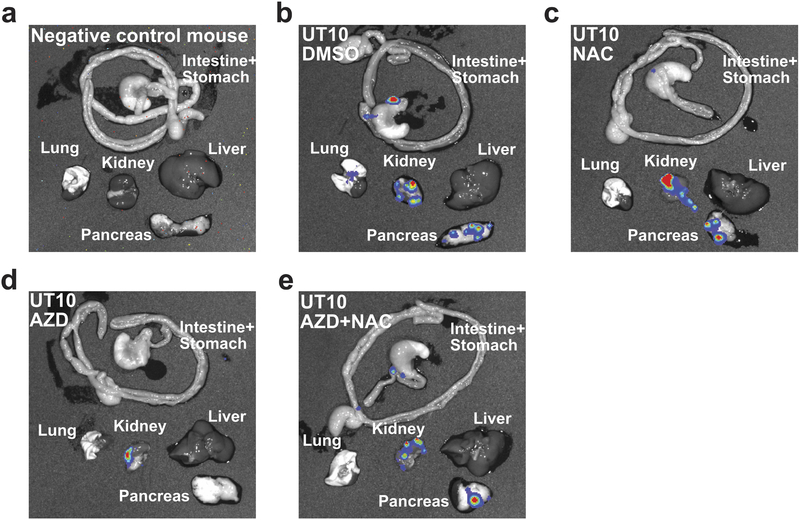
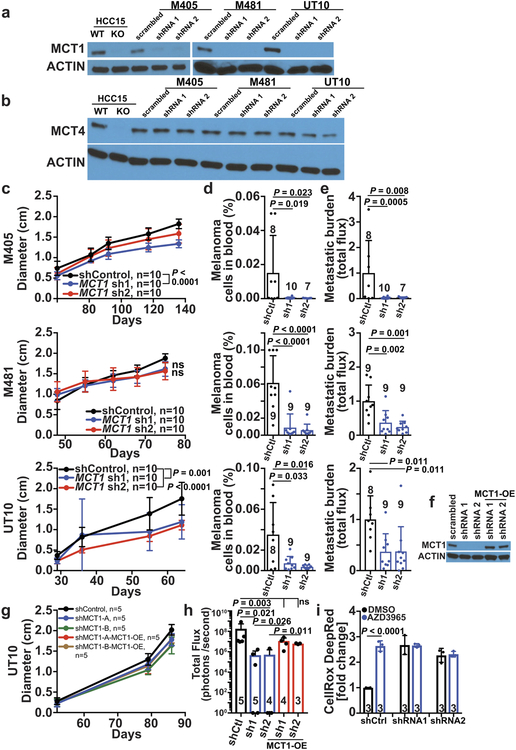
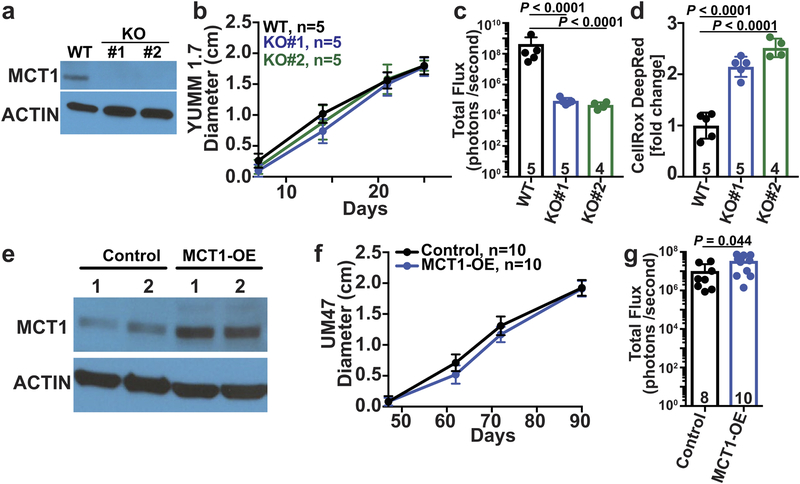
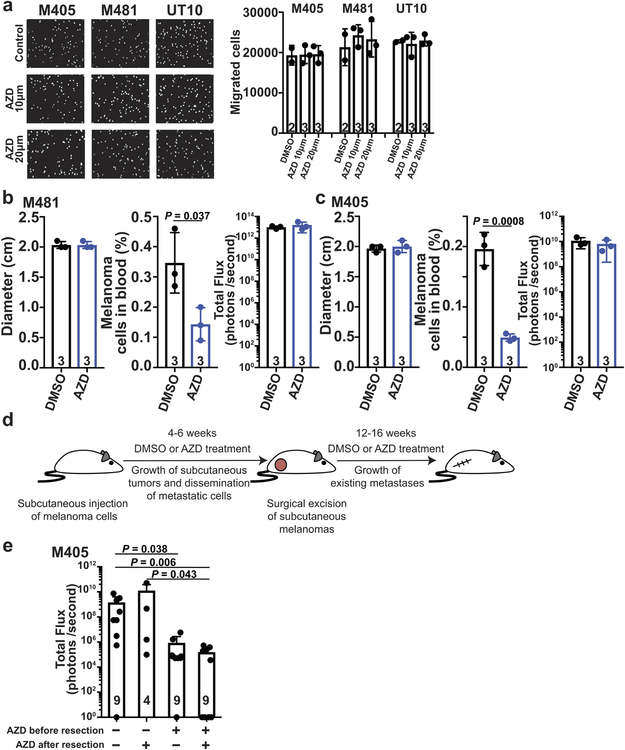
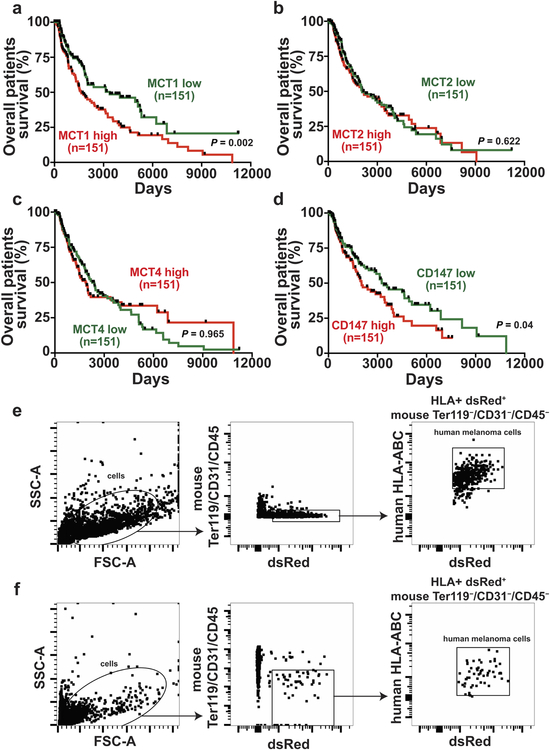
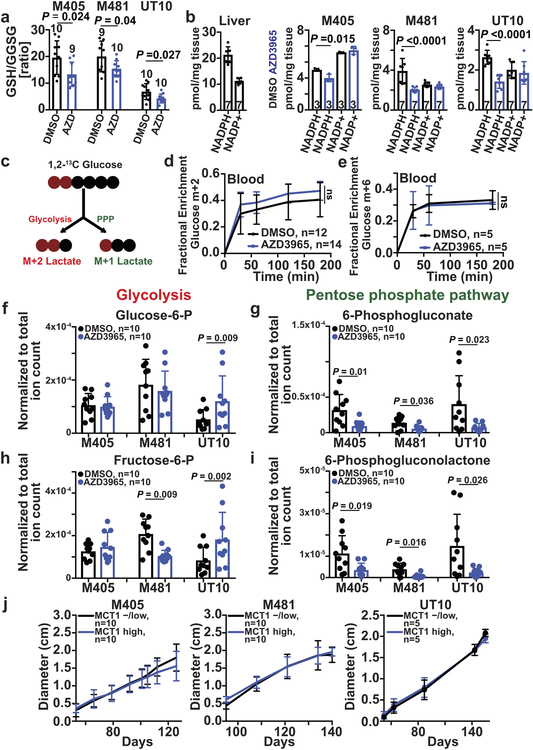
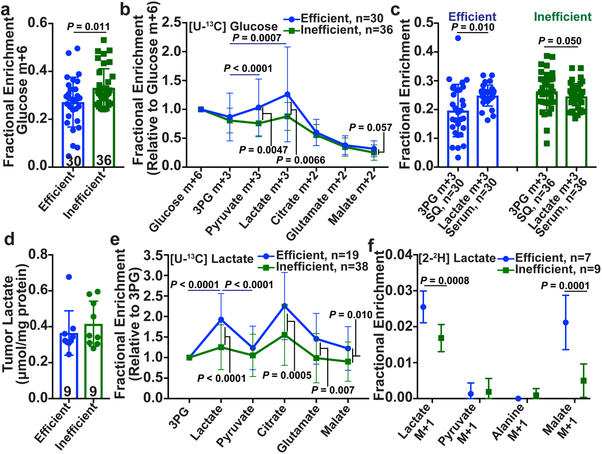
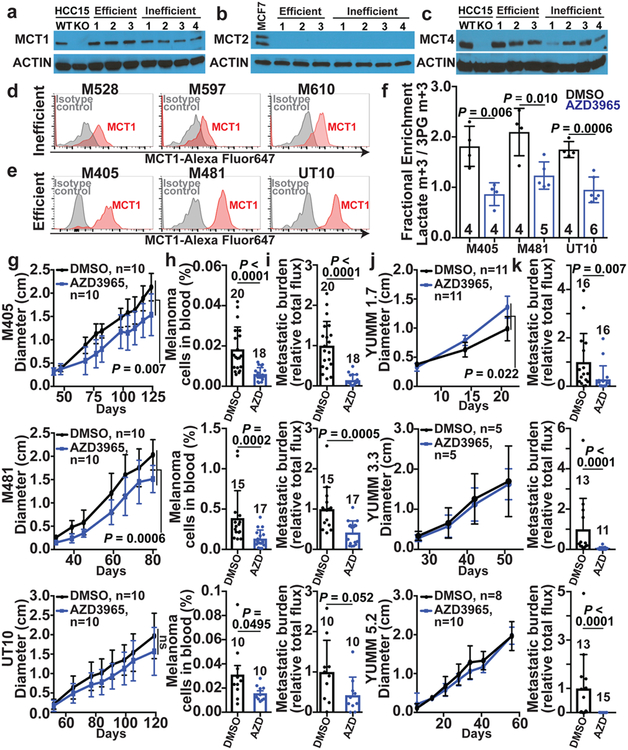
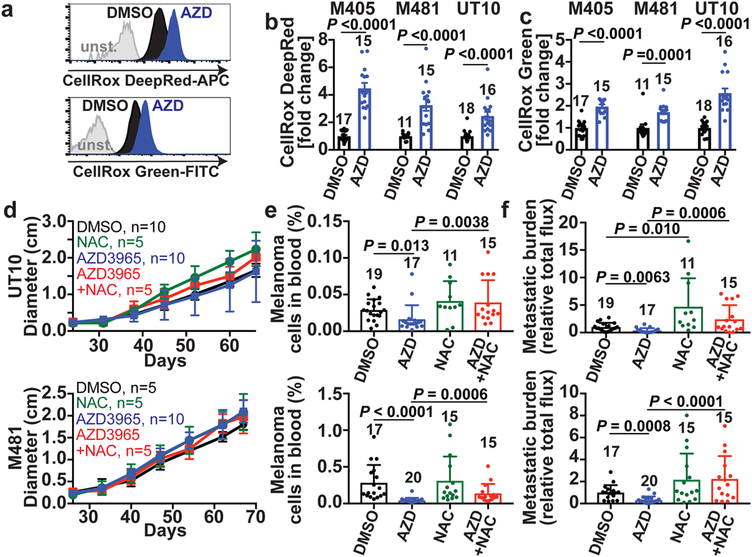
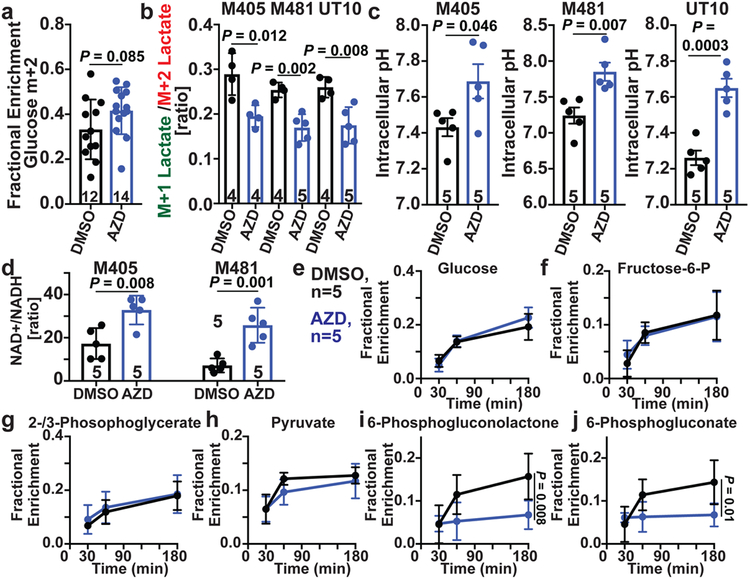
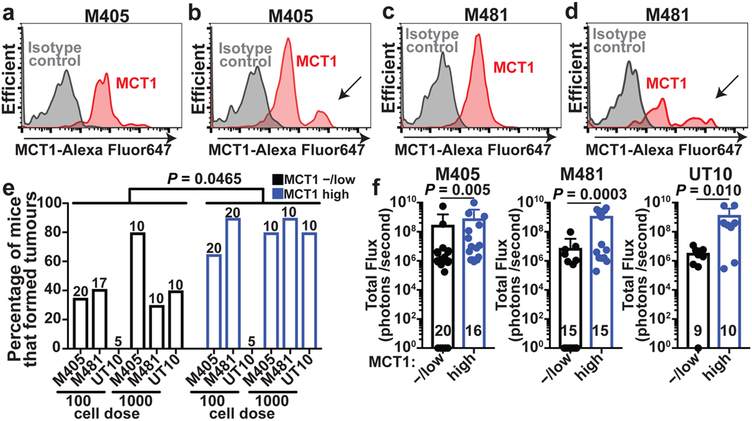
Metastasis requires cancer cells to undergo metabolic changes that are poorly understood1-3. Here we show that metabolic differences among melanoma cells confer differences in metastatic potential as a result of differences in the function of the MCT1 transporter. In vivo isotope tracing analysis in patient-derived xenografts revealed differences in nutrient handling between efficiently and inefficiently metastasizing melanomas, with circulating lactate being a more prominent source of tumour lactate in efficient metastasizers. Efficient metastasizers had higher levels of MCT1, and inhibition of MCT1 reduced lactate uptake. MCT1 inhibition had little effect on the growth of primary subcutaneous tumours, but resulted in depletion of circulating melanoma cells and reduced the metastatic disease burden in patient-derived xenografts and in mouse melanomas. In addition, inhibition of MCT1 suppressed the oxidative pentose phosphate pathway and increased levels of reactive oxygen species. Antioxidants blocked the effects of MCT1 inhibition on metastasis. MCT1high and MCT1-/low cells from the same melanomas had similar capacities to form subcutaneous tumours, but MCT1high cells formed more metastases after intravenous injection. Metabolic differences among cancer cells thus confer differences in metastatic potential as metastasizing cells depend on MCT1 to manage oxidative stress.


Figures

Extended Data Figure 1.
Extended Data Figure 1.. Plasma enrichment of isotopically-labelled metabolites after infusion into xenografted mice. Related to Figure 1.
a, Summary of the melanomas used in this study and their spontaneous metastatic behavior after subcutaneous transplantation into NSG mice. Melanomas were characterized as inefficient or efficient metastasizers. Before subcutaneous tumors grew to 2.5 cm in diameter (when the mice were killed per approved protocol), inefficient metastasizers rarely formed macrometastases or micrometastases beyond the lung whereas efficient metastasizers commonly formed macrometastases as well as micrometastases in multiple organs (the data reflect results from 1 to 5 independent experiments per melanoma). Some of these data have been published previously. b-g, Isotope tracing was performed in NSG mice subcutaneously xenografted with efficiently metastasizing melanomas from four patients (M405, M481, M487, and UT10) and inefficiently metastasizing melanomas from nine patients (M715, UM17, UM22, UM43, UM47, M498, M528, M597 and M610). The number of tumors/mice analyzed per treatment is indicated in each panel. b, Glutamine m+5 as a fraction of total plasma glutamine in mice infused with [U-13C]glutamine (14 independent experiments). c, Isotope enrichment in subcutaneous tumors after [U-13C]glutamine infusion (14 independent experiments). d, Glucose m+6 as a fraction of total plasma glucose in mice infused with [U-13C]glucose (20 independent experiments). e, Plasma glucose and lactate concentrations before and after infusion. f, Lactate m+3 as a fraction of total plasma lactate in mice infused with [U-13C]lactate (23 independent experiments). g, Lactate m+1 as a fraction of total plasma lactate in mice infused with [2-2H]lactate (three independent experiments). h, Expected isotope labelling after [2-2H]lactate infusion. i, Western blot analysis of lactate dehydrogenase A and B in subcutaneous tumors from NSG mice xenografted with efficiently (M405, M481, and UT10) or inefficiently (UM17, UM43, and UM47) metastasizing melanomas (representative of four independent experiments). All data represent mean ± s.d. Statistical significance was assessed using Mann-Whitney tests (c) and t-tests at 180 or 300 minutes when tumors were harvested for analysis (b, d and f-g) or paired t-tests (e).
Extended Data Figure 2.
Extended Data Figure 2.. Efficient metastasizers express higher levels of MCT1 than inefficient metastasizers. Related to Figure 2.
a, Quantification of MCT1 relative to Actin bands from the western blot in Figure 2a comparing efficient versus inefficient metastasizers. b, Quantification of MCT4 relative to Actin bands from the western blot in Figure 2c comparing efficient versus inefficient metastasizers. c-d, Quantification of mean fluorescence intensities for MCT1 staining in the flow cytometry plots comparing efficient (Fig. 2e) and inefficient (Fig. 2d) metastasizers. HCC15 cells and MCT1-deficient HCC15 cells were positive and negative controls (c). e-f, Immunofluorescence staining for MCT1 (green) in sections from subcutaneous tumors from inefficiently (e, UM47) or efficiently (f, M405) metastasizing melanomas. An adjacent section was stained with an antibody against S100b (a melanoma marker, green). Images are representative of three independent experiments per melanoma. g,h Immunofluorescence staining for MCT1 (green) in sections from subcutaneous tumors from inefficient (g, M498, M610, and M597) and efficient (h, M481, UT10, and M405) metastasizers. In each case, an adjacent section was stained with an antibody against S100b (a melanoma marker, green). Images are representative of results from two independent experiments per melanoma. i-j, While efficient metastasizers often exhibited cell surface staining (j), inefficient metastasizers typically exhibited diffuse cytoplasmic staining (i). Images are representative of results from two independent experiments per melanoma. All data represent mean ± s.d.. Statistical significance was assessed using Student’s t-tests (a-b and d).
Extended Data Figure 3.
Extended Data Figure 3.. MCT1 inhibition impairs metastasis without altering MCT1, CD147, CD98, or β1-Integrin expression levels. Related to Figure 2.
a-c, Western blot analysis of MCT1 (a), MCT4 (b) and CD147 (c) in subcutaneous tumours versus metastatic liver (liv), kidney (kid), and pancreas (pan) nodules from NSG mice transplanted with three melanomas. d-g, Flow cytometry histograms of anti-MCT1 (d, e), or anti-CD147 (f, g) staining in melanoma cells from subcutaneous tumors or metastatic nodules from mice transplanted with M405 (d, f) or M481 (e, g) melanomas. h-o, Flow cytometry histograms and mean fluorescence intensities of anti-MCT1 (h, i), anti-CD147 (j, k), anti-CD98 (l, m), or anti-β1-Integrin (n-o) staining in melanoma cells from subcutaneous tumors treated with DMSO (control; black) or AZD3965 (MCT1 inhibitor; blue). The number of tumors/mice analyzed in each treatment is indicated within the bars in each panel (2 to 3 experiments). In all flow cytometric analyses, human melanoma cells were distinguished from mouse cells based on positivity for HLA-ABC and DsRed and negativity for mouse CD31/CD45/Ter119 staining (see Extended Data Figure 9e and 9f for gating strategy). p-u, Western blot analysis of IKKα (p-r) and IKKβ (s-u) in subcutaneous tumors from NSG mice treated with DMSO or AZD3965. All data represent mean ± s.d. Statistical significance was assessed with two-way ANOVAs (i, k, m, and o).
Extended Data Figure 4.
Extended Data Figure 4.. MCT1 inhibition with AZD3965 impairs metastasis without altering markers of epithelial to mesenchymal transition (EMT). Related to Figure 2.
Flow cytometry histograms of anti-E-cadherin (a) and anti-N-cadherin (b) staining in melanoma cells from subcutaneous tumors of mice treated with DMSO (control) or AZD3965. Human keratinocytes were included as a control in each case as they are known to include subpopulations of E-cadherin and N-cadherin positive cells. In xenografts, human melanoma cells were distinguished from mouse cells based on positivity for HLA-ABC and DsRed and negativity for mouse CD31/CD45/Ter119 staining (Extended Data Figure 9e and 9f for gating strategy). The data are representative of 2–3 mice analyzed in two independent experiments. c, Western blot analysis of vimentin in subcutaneous tumors from NSG mice treated with DMSO or AZD3965.
Extended Data Figure 5.
Extended Data Figure 5.. Representative images of the bioluminescence analysis of visceral organs to determine metastatic disease burden at endpoint. Related to Figures 2, 3 and 5.
a-e, Visceral organs were surgically removed from each mouse at endpoint and imaged to identify macro and micrometastases and to determine bioluminescence signal intensity. Each melanoma was tagged with constitutive luciferase expression.
Extended Data Figure 6.
Extended Data Figure 6.. shRNA mediated knockdown of MCT1 inhibits melanoma metastasis in vivo. Related to Figure 2.
a, Western blot analysis of MCT1 in subcutaneous tumors from mice xenografted with efficiently metastasizing melanomas transfected with scrambled control shRNA or shRNA1 or shRNA2 against MCT1. HCC15 cells were used as a positive control and MCT1-deficient HCC15 cells were used as a negative control (representative of 2 independent experiments). b, Western blot analysis of MCT4 in subcutaneous tumors from mice xenografted with efficiently metastasizing melanomas transfected with scrambled control shRNA or shRNA1 or shRNA2 against MCT4. HCC15 cells were used as a positive control and MCT4-deficient HCC15 cells were used as a negative control. c-e, Growth of subcutaneous tumors (c) in mice transplanted with melanomas transfected with scrambled control shRNA or shRNA1 or shRNA2 against MCT1. The number of mice analyzed in each treatment is indicated in each panel (one experiment per melanoma). The frequency of circulating melanoma cells in the blood (d) and metastatic disease burden based on bioluminescence imaging (e) in the same mice. f, Western blot analysis of MCT1 in subcutaneous tumors transfected with scrambled control shRNA or shRNA1 or shRNA2 against MCT1, with (OE) or without an shRNA-insensitive MCT1 cDNA. g-h, Growth of subcutaneous tumors (g) and metastatic disease burden at endpoint (h) in mice transplanted with melanomas transfected with scrambled control shRNA or shRNA1 or shRNA2 against MCT1 and an shRNA-insensitive MCT1 cDNA. i, Fold change in mean fluorescence intensity for CellRox DeepRed staining (ROS) in xenografted melanoma cells with scrambled control shRNA or shRNA1 or shRNA2 against MCT1 treated with AZD3965 or DMSO. All data represent mean ± s.d.. Statistical significance was assessed using nparLD followed by Benjamiani-Hochberg’s multiple comparisons adjustment (c), log2 one-way ANOVAs with Holm-Sidak’s multiple comparisons adjustment (d-e and h), mixed-effects analysis followed by Dunnett’s multiple comparisons adjustment (g), or log2 two-way ANOVA with Sidak’s multiple comparisons adjustment (i).
Extended Data Figure 7.
Extended Data Figure 7.. CRISPR deletion of MCT1 from mouse melanoma cells impairs metastasis while MCT1 over-expression in patient-derived xenografts increases metastasis. Related to Figure 2.
a, Western blot analysis of MCT1 in wild-type parental YUMM1.7 melanoma cells as well as two lines from which MCT1 had been deleted using CRISPR. b-d, Growth of subcutaneous tumors (b), total metastatic disease burden at endpoint by bioluminescence imaging of visceral organs (c) and CellRox DeepRed staining of subcutaneous tumor cells (d). The number of mice analyzed in each treatment is indicated in each panel (one experiment; note that one mouse died in the KO#2 treatment before endpoint analysis). e, Western blot analysis of MCT1 in an inefficiently metastasizing melanoma (UM47) expressing MCT1 cDNA. f-g, Growth of subcutaneous tumors (f) and total metastatic disease burden at endpoint by bioluminescence imaging of visceral organs (g) from mice transplanted with these melanomas (one experiment; note that two mice died in the control treatment before endpoint analysis). All data represent mean ± s.d.. Statistical significance was assessed using one-way ANOVA followed by Dunnett’s multiple comparison adjustment (b: day 25) or log2 one-way ANOVAs followed by Dunnett’s multiple comparisons adjustment (c-d), t-test (f: day 90) or log2 t-test (g).
Extended Data Figure 8.
Extended Data Figure 8.. MCT1 inhibition does not impair the migration of melanoma cells in culture but appears to reduce metastatic disease burden by killing metastasizing melanoma cells in vivo. Related to Figure 2.
a, Migration in transwell invasion assays of three melanomas treated with DMSO (control) or AZD3965 (MCT1 inhibitor), including representative images (left) and counts (right) of the cells that migrated across the insert after 24 hours (one experiment with two to three replicate cultures per melanoma). b-c, Effect of acute treatment with AZD3965 (7 days) on the diameter of subcutaneous tumors, the frequency of circulating melanoma cells in the blood, and metastatic disease burden in mice with established M481 (b) or M405 (c) melanomas. Treatment was initiated when the subcutaneous tumors reached 2 cm in diameter (one experiment per melanoma with three mice per treatment). d, Efficiently metastasizing melanoma cells (M405) were subcutaneously transplanted into mice, allowed to spontaneously metastasize, then the primary tumors were resected to prolong survival and to allow the metastatic tumors that had formed prior to primary tumor resection to grow larger. Mice were treated with AZD3965 for the duration of the experiment, only prior to primary tumor resection, or only after primary tumor resection. e, Analysis of total metastatic disease burden at endpoint showing that metastatic disease burden was reduced when AZD3965 treatment was performed prior to primary tumor resection, during the time when melanoma cells were spontaneously metastasizing, but before metastatic tumors were established. The number of mice per treatment is shown in the panel (two independent experiments). All data represent mean ± s.d.. Statistical significance was assessed using two-way ANOVAs followed by Dunnett’s multiple comparison’s adjustment (a), t-tests (b-c) or Kruskal-Wallis test followed by Dunn’s multiple comparison’s adjustment (e).
Extended Data Figure 9.
Extended Data Figure 9.. Increased MCT1 expression in melanomas is associated with significantly worse patient survival. Related to Figure 2.
a-d, Kaplan-Meier overall survival curves of melanoma patients stratified based on MCT1 (a), MCT2 (b), MCT4 (c), and CD147 (d) expression level within tumor specimens. Data were from the SKCM cohort in TCGA (https://portal.gdc.cancer.gov/projects/TCGA-SKCM). Each panel compares the top third of patients with the highest expression levels versus the bottom third of patients with the lowest expression levels. Ticks represent censored values. e-f, Flow cytometry plots showing the gating strategies used to identify human melanoma cells in subcutaneous tumors (e) or the blood (f) of xenografted mice. Cells were gated on forward versus side scatter (FSC-A vs. SSC-A) to exclude red blood cells and clumps of cells. Human melanoma cells were selected by including cells that stained positively for DsRed (stably expressed in all melanoma lines) and HLA and excluding cells that stained positively for the mouse hematopoietic and endothelial markers CD45, CD31, or Ter119. The statistical significance of the differences in overall survival (a-d) were assessed using the Mantel-Cox log-rank test.
Extended Data Figure 10.
Extended Data Figure 10.. MCT1 inhibition reduces the levels of pentose phosphate pathway, but not glycolytic, metabolites. Related to Figures 3–5.
a, Glutathione (GSH) to oxidized glutathione (GSSG) ratios in melanoma cells from mice treated with AZD3965 or DMSO (two independent experiments per melanoma). b, Quantitative analysis of NADPH and NADP+ in melanoma cells from mice treated with AZD3965 or DMSO (one or two experiments per melanoma). Liver cells were included as a control, with a high NADPH/NADP+ ratio. c, Expected isotope labelled species after [1,2-13C]glucose infusion. d, Glucose m+2 as a fraction of total plasma glucose in mice xenografted with efficiently metastasizing melanomas (M405, M481, and UT10), treated with DMSO or AZD3965, and infused with [1,2-13C]glucose. e, Glucose m+6 as a fraction of total plasma glucose in mice infused with [U-13C]glucose. The number of mice per treatment is indicated in each panel (two independent experiments). f-i, LC-MS measurement of the levels of glycolytic (f, h) and oxidative pentose phosphate pathway (g, i) metabolites in subcutaneous tumor cells from mice xenografted with melanomas treated with DMSO (control) or AZD3965 (MCT1 inhibitor) for 7 days. j, Flow cytometrically isolated MCT1high or MCT1−/low melanoma cells were subcutaneously transplanted into NSG mice, using 10 or 100 cells per injection. All injections formed tumors. Rate of growth of the tumors initiated with 10-cell injections. All data represent mean ± s.d.. Statistical significance was assessed using t-tests (a), repeated measures two-way ANOVAs (b), t-test (e: 180 min), log2 two-way ANOVAs (f and h), log2 t-tests (g: M405 and UT10), Mann-Whitney test (g: M481 and i: M481), Welch’s t-tests (i: M405 and UT10) or using nparLD test (d and j).
Figure 1.
Figure 1.. Efficiently metastasizing melanomas exhibit enhanced lactate uptake in vivo.
Isotope tracing in primary subcutaneous tumors xenografted in NSG mice with efficiently (M405, M481, M487, and UT10) and inefficiently (M715, UM17, UM22, UM43, UM47, M498, M528, M597 and M610) metastasizing melanomas. The number of mice/tumors per treatment is indicated in each panel. a-b, Glucose m+6 as a fraction of the glucose pool (a) and enrichment of other metabolites normalized to m+6 glucose (b) in subcutaneous tumors after [U-13C]glucose infusion. c, 3-phosphoglycerate (3PG) m+3 fraction in subcutaneous tumors and lactate m+3 fraction in the plasma of mice infused with [U-13C]glucose (20 experiments). d, Tumor lactate concentration (3 experiments). e, Enrichment of metabolites normalized to 3PG m+3 in subcutaneous tumors after [U-13C]lactate infusion (23 experiments). f Isotope labelling after [2-2H]lactate infusion (3 experiments). Data represent mean ± s.d. Statistical significance was assessed using t-tests (a and f), paired t-tests (c), log2 t-tests to compare efficient versus inefficient melanomas or Wilcoxon tests to compare metabolites (b and e). Multiple comparisons were adjusted using the Holm-Sidak’s method (b, c, e, and f).
Figure 2.
Figure 2.. MCT1 inhibition selectively impairs metastasis in human and mouse melanomas.
a-c, Western blot analysis of MCT1 (a), MCT2 (b), and MCT4 (c) in 3 efficiently (M405, M481, and UT10) and 4 inefficiently (M498, M528, M597 and M610) metastasizing xenografted melanomas. Positive and negative controls for MCT1 and MCT4 were HCC15 cells and MCT1 or MCT4 deficient HCC15 cells. MCF7 cells were a positive control for MCT2. The data are representative of 4 (MCT1), 2 (MCT2), and 2 (MCT4) experiments. d-e, Flow cytometric analysis of MCT1 surface expression in inefficiently (d) and efficiently (e) metastasizing melanomas. f, Enrichment of lactate m+3 normalized to 3PG m+3 in xenografted tumors after treatment with the MCT1 inhibitor, AZD3965, or DMSO control and [U-13C]lactate infusion (2 experiments per melanoma). The number of mice per treatment is indicated in each panel. g-i, Growth of subcutaneous tumors (g) in mice treated with AZD3965 (AZD) or DMSO control as well as the frequency of circulating melanoma cells in the blood (h) and metastatic disease burden based on bioluminescence imaging (i). Data in h and i reflect 1 (UT10) or 2 experiments per melanoma, but only one representative experiment per melanoma is shown in g. j-k, Growth of subcutaneous tumors (j) and metastatic disease burden at endpoint by bioluminescence imaging (k) in mice transplanted with YUMM1.7, YUMM3.3, or YUMM5.2 mouse melanomas and treated with AZD3965 (AZD) or DMSO control (two experiments per melanoma). Data represent mean ± s.d. Statistical significance was assessed using t-tests (f), nparLD (g), mixed effects analysis (j) or Mann-Whitney tests (h-i and k).
Figure 3.
Figure 3.. MCT1 inhibition causes oxidative stress in melanoma cells.
a-c, Representative flow cytometry histograms of ROS levels (a) and fold change in mean fluorescence intensity (b, c) in melanoma cells from mice treated with AZD3965 (AZD, blue) or DMSO control (black) (two experiments per melanoma). The number of tumors/mice analyzed per treatment is indicated in each panel. d–f, Growth of subcutaneous tumors (d) in xenografted mice treated with DMSO, AZD3965, N-acetyl-cysteine (NAC), or AZD3965+NAC as well as the frequency of circulating melanoma cells in the blood (e) and metastatic disease burden based on bioluminescence imaging at endpoint (f). Data in e and f reflect 3 experiments per melanoma, but only one representative experiment per melanoma is shown in d. Data represent mean ± s.d. Statistical significance was assessed using log2 t-tests (b), Mann-Whitney tests (c), , nparLD followed by Benjamini-Hochberg’s multiple comparisons adjustment (d), and log2 one-way ANOVAs with Holm-Sidak’s multiple comparisons adjustment (e-f).
Figure 4.
Figure 4.. MCT1 inhibition reduces flux through the oxidative branch of the pentose phosphate pathway relative to glycolysis.
a, Glucose m+2 as a fraction of total glucose in xenografted tumors after [1,2-13C]glucose infusion (6 experiments). The number of tumors/mice per treatment is indicated in each panel. b, Lactate m+1/lactate m+2 ratio in subcutaneous tumors from the same mice (two experiments per melanoma). c,d, Intracellular pH (c) and NAD+/NADH ratio (d) in dissociated melanoma cells from subcutaneous tumors (one experiment per melanoma). e-j, Fractional enrichment in upper (e, f) and lower (g, h) glycolytic as well as pentose phosphate pathway (i, j) metabolites 30, 60, or 180 minutes after [U-13C]glucose infusion (2 experiments). Data represent mean ± s.d. Statistical significance was assessed using t-tests (a), nparLD (c), t-tests (b-d) or repeated measures two-way ANOVAs (e-j).
Figure 5.
Figure 5.. Heterogeneous MCT1 expression among melanoma cells from the same tumor.
a-d, Flow cytometric analysis of anti-MCT1 staining in melanoma cells from subcutaneous tumors (a,c) or circulating melanoma cells (b,d) from the same mice xenografted with M405 (a-b) or M481 (c-d) (Extended Data Fig. 9e and 9f show the gating strategies to identify human melanoma cells; the data are representative of 3 experiments). e, Flow cytometrically isolated MCT1high or MCT1−/low melanoma cells were intravenously transplanted into NSG mice, using 100 or 1000 cells per injection. The panel shows the percentage of injections that formed metastatic tumors (1–2 experiments per melanoma). The number of mice analyzed per treatment is indicated in each panel. f, Metastatic disease burden in the visceral organs of mice that survived to endpoint after injection with 100 cells (M405 and M481) or 1000 cells (UT10) based on bioluminescence signal intensity. Data represent mean ± s.d. Statistical significance was assessed using multiple linear regression (e) or Mann-Whitney tests (f).

Comment in

  • Surviving stress during metastasis.
    Seton-Rogers S. Seton-Rogers S. Nat Rev Cancer. 2020 Mar;20(3):139. doi: 10.1038/s41568-020-0243-4. Nat Rev Cancer. 2020. PMID: 32020065 No abstract available.

References

    1. Vanharanta S & Massague J Origins of metastatic traits. Cancer Cell 24, 410–421 (2013). - PMC - PubMed
    1. Le Gal K et al. Antioxidants can increase melanoma metastasis in mice. Sci Transl Med 7, 308re308 (2015). - PubMed
    1. Piskounova E et al. Oxidative stress inhibits distant metastasis by human melanoma cells. Nature 527, 186–191 (2015). - PMC - PubMed
    1. Luo M et al. Targeting Breast Cancer Stem Cell State Equilibrium through Modulation of Redox Signaling. Cell Metab 28, 69–86 (2018). - PMC - PubMed
    1. Kfoury A et al. AMPK promotes survival of c-Myc-positive melanoma cells by suppressing oxidative stress. EMBO J 37 (2018). - PMC - PubMed

Publication types

Substances