. 2019 Dec 6;9(1):1697583.
doi: 10.1080/20013078.2019.1697583. eCollection 2020.

Characterization of protein, long noncoding RNA and microRNA signatures in extracellular vesicles derived from resting and degranulated mast cells

Affiliations

Characterization of protein, long noncoding RNA and microRNA signatures in extracellular vesicles derived from resting and degranulated mast cells

Yuting Liang et al. J Extracell Vesicles. .

Abstract

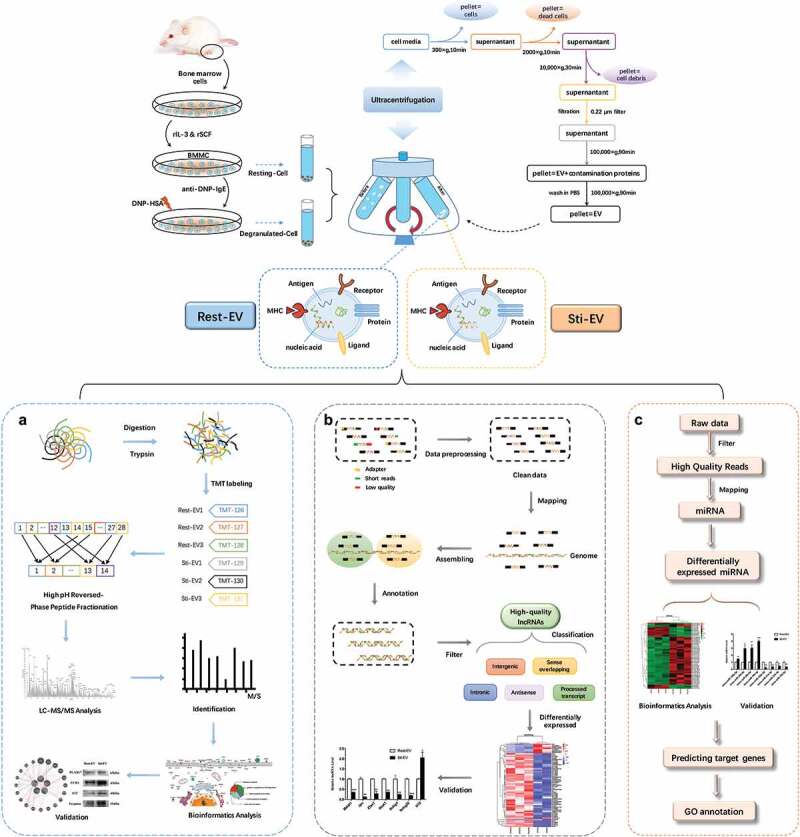
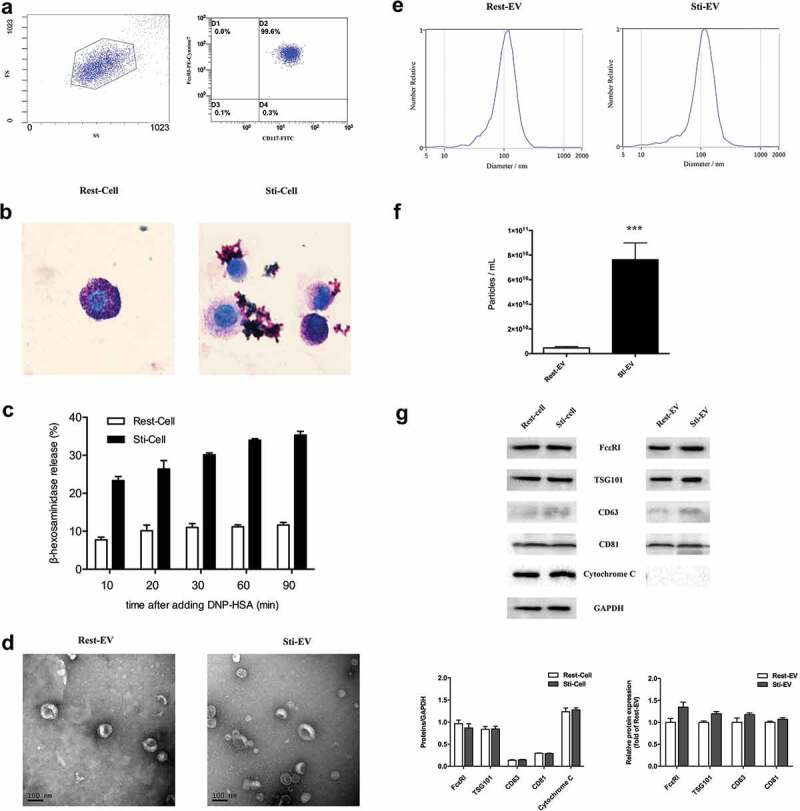
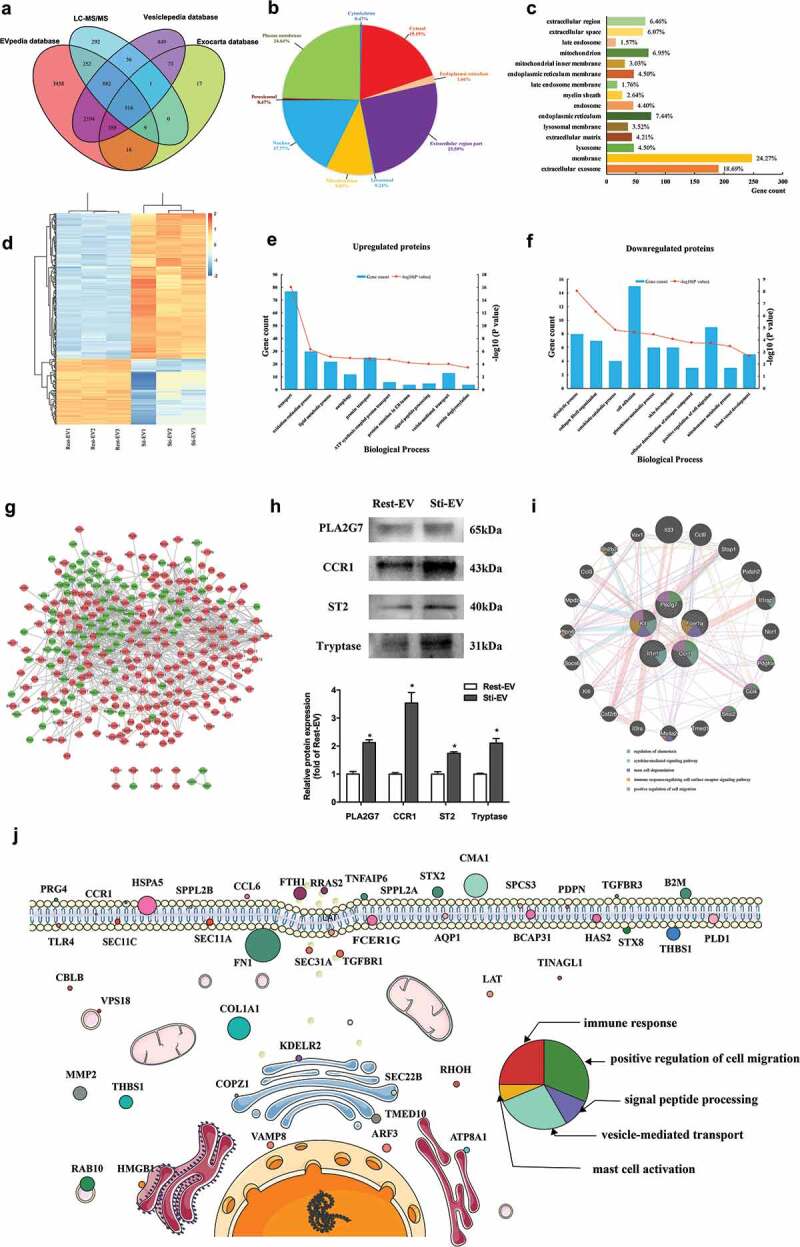
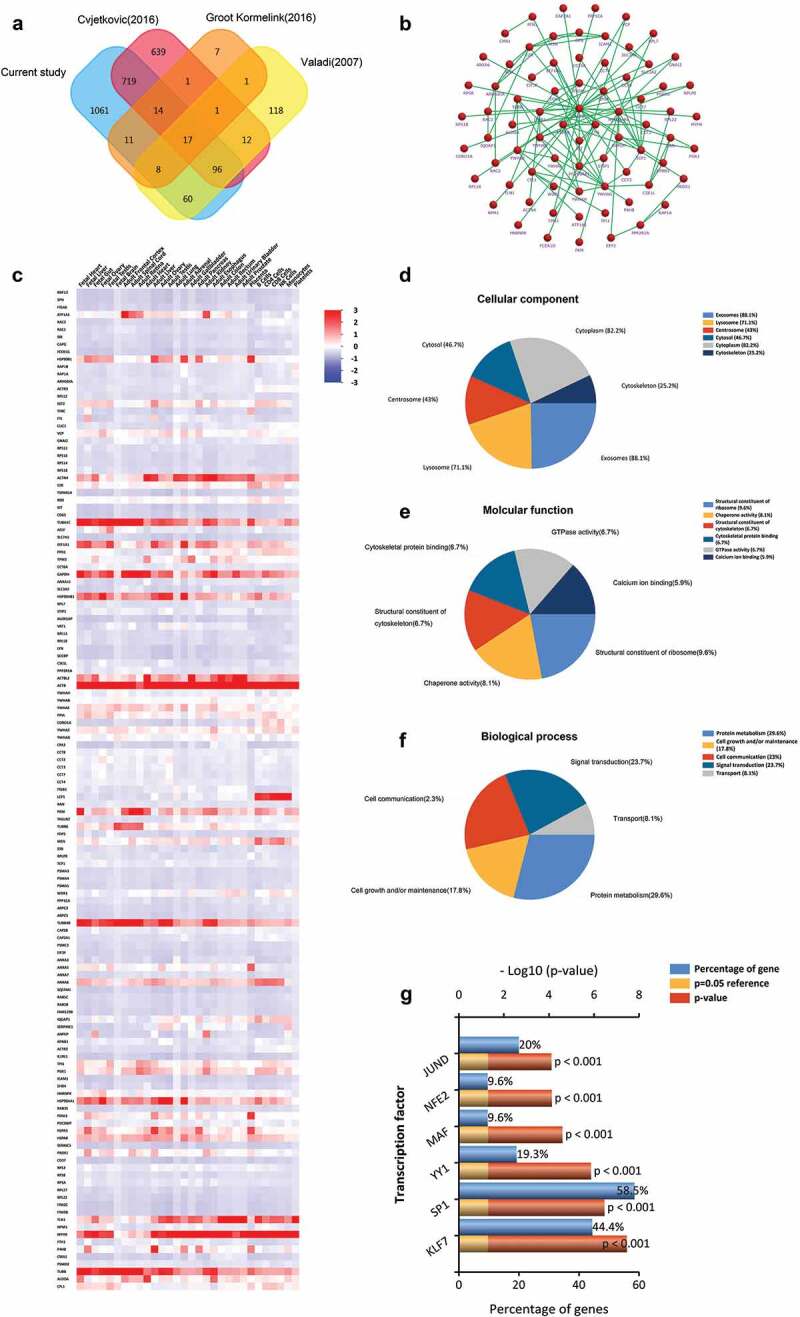
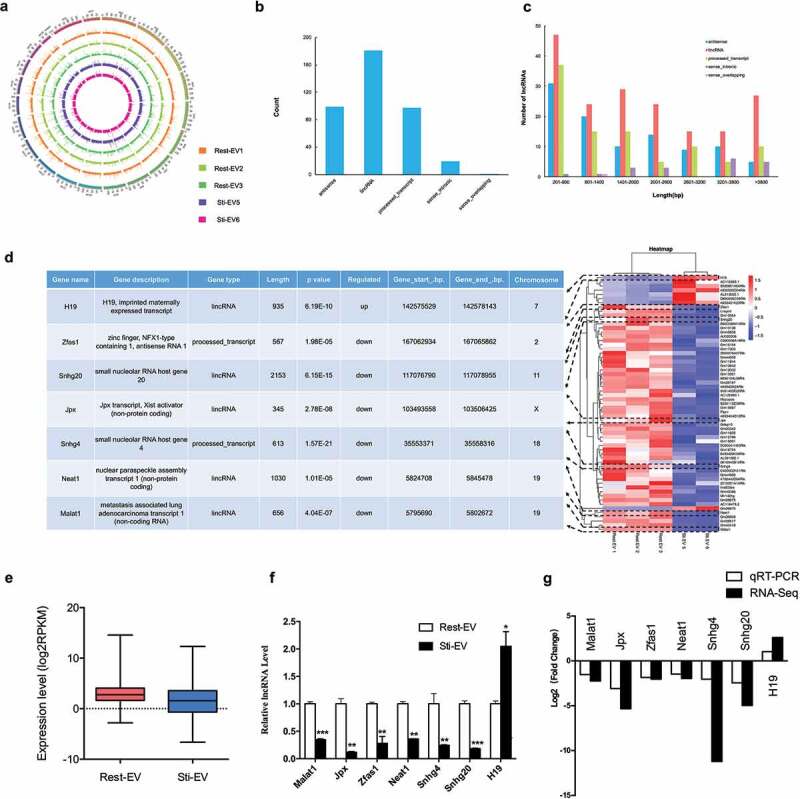
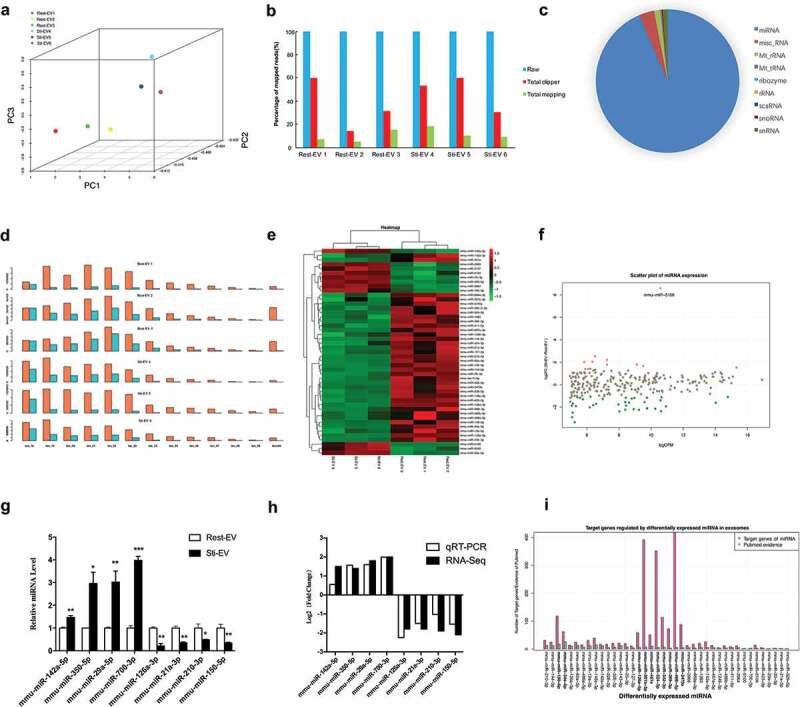
Mast cells (MCs) are known to participate in a variety of patho-physiological processes depending largely on the intragranular mediators and the production of cytokines and chemokines during degranulation. Recently, extracellular vesicles (EVs) have been implicated important functions for MCs, but the components of MC-derived EVs have not yet been well-characterized. In this study, we aimed to identify signatures of proteins, long non-coding RNAs (lncRNAs), and microRNAs (miRNAs) in EVs derived from resting (Rest-EV) and degranulated (Sti-EV) MCs by differential ultracentrifugation. Using tandem mass tag (TMT)-based quantitative proteomics technology and RNA sequencing, we identified a total of 1988 proteins, 397 lncRNAs, and 272 miRNAs in Rest-EV and Sti-EV. The proteins include common EVs markers (cytoskeletal proteins), MCs markers (FcεRI and tryptase), and some preformed MCs mediators (lysosomal enzymes) as well. The global expression profiles of lncRNAs and miRNAs identified, for the first time, from Rest-EV and Sti-EV, strongly suggest a potential regulatory function of MC-derived EVs. We have also performed Western blotting and qRT-PCR analysis to further verify some of the proteins, lncRNAs, and miRNAs identified from Rest-EV and Sti-EV. Our findings will help to elucidate the functions of MC-derived EVs, and provide a reference dataset for future translational studies involving MC-derived EVs.

Keywords: EVs; Mast cells; lncRNAs; miRNAs; proteomics.


Conflict of interest statement

No potential conflicts of interest were reported by the authors.

Figures

Figure 1.
Figure 1.
Schematic representation of BMMC-derived EVs isolation, and characterization. The TMT-labelling strategy elucidates the enrichment of proteins encapsulated in MC-derived EVs and RNA-seq to identify the expression profiles of lncRNAs and miRNAs. Murine bone marrow cells were induced to differentiate into MCs by rIL-3 and SCF in vitro. EVs released by resting and degranulated BMMCs (Rest-EV and Sti-EV) were isolated by successive differential centrifugation. (a) Flowchart of the TMT-labelling quantitative proteomic analysis of Rest-EV and Sti-EV. Proteins were extracted and digested by filter-aided sample preparation (FASP). The peptides were labelled with six-plex tandem mass tags (TMT) and analysed using EASY-nano-LC−MS/MS in MaxQuant software. The differentially expressed proteins (DEPs) were further analysed by bioinformatics tools and followed by biological validation using Western blotting. (b) Overview of the comprehensive scheme for the systematic identification of lncRNAs in Rest-EV and Sti-EV. The quality control of the RNA sequences was performed by the FastQC software. High-quality lncRNAs were obtained by a series of steps, such as mapping, assembling, annotation, and filtering. The assembled putative lncRNAs were classified into five categories, including antisense lncRNAs, intergenic lncRNAs (lincRNAs), processed transcript lncRNAs, sense intronic lncRNAs, and sense overlapping lncRNAs. The differentially expressed (DE) lncRNAs were further analysed by bioinformatics tools and followed by biological validation using qRT-PCR. (c) Flowchart of small RNA-seq data analysis. Preprocessing of the reads was accomplished through mapper.pl script of miRDeep2 software. Bowtie software was used to trim and align generated sequence reads; and mapping of the reads to miRBase was included. The DE miRNAs were investigated by the Bioconductor R packages and followed by biological validation using qRT-PCR. The miRTarBase database was used to analyse miRNA target interactions. Analysis of gene ontology annotation was performed by applying the DAVID functional annotation tool.
Figure 2.
Figure 2.
Identification and characterization of EVs secreted by resting and degranulated BMMCs. (a) Murine bone marrow cells were induced to differentiate into MCs by rSCF and rIL-3 in vitro, as shown in Figure 1. CD117 and IgE high affinity receptor (FcεRI) on BMMCs were detected by flow cytometry, and 99.6% of all cells were double positive. (b) Toluidine blue staining for resting and degranulated BMMCs (1000×). The resting BMMCs were round, and the cytoplasm was filled with clearly visible purple-red granules. These mauve granules were released into the extracellular environment during IgE mediated MCs degranulation. (c) The release rate of β-hexosaminidase was assessed by incubating IgE-primed MCs with DNP-HSA for different times. Next, EVs were isolated from resting and degranulated MCs through differential centrifugation. The specific steps of centrifugation are shown in Figure 1. (d) Transmission electron micrographs of the isolated EVs revealed cup-shaped structures with a diameter of approximately 30–150 nm. The scale bar indicates 100 nm. (e) The average size and quantity of EVs were measured by Nanoparticle Tracking Analysis (NTA). The results show that degranulated MCs released more EVs compared to the same number of resting MCs (f). (g) Western blotting analysis of the EVs show that Rest-EV and Sti-EV expressed traditional EVs markers CD63, CD81, and TSG101 and the MCs specific receptor, FcεRI. However, cytochrome C was highly enriched in the parental cells compared with corresponding EVs samples. Note: (* p < 0.05, ** p < 0.01 and *** p < 0.001).
Figure 3.
Figure 3.
Global profiling of proteins encapsulated in MC-derived EVs using Mass spectrometry. (a) Venn diagrams of proteins identified in MC-derived EVs by mass spectrometry. The total number of proteins identified was compared with results from the Exocarta database of published EVs proteomics. Intracellular protein locations of differential expression proteins (DEPs) were assigned by the WoLF PSORT online tool (b) and Gene Ontology annotations (c). (d) Hierarchical clustering analysis of a heat map of the 415 DEPs was performed by the package “pheatmap” in R programme, revealing that the molecular profile of each group is unique, with the biological replicates being closest together. The red colour indicates increased protein abundances in Sti-EV, and the green colour indicates increased protein abundances in Rest-EV. The 10 most significantly enriched GO biological processes (−log10(p values), p < 0.05) in proteomic data of EVs secreted from resting (e) and degranulated MCs (f) were identified in this study. (g) Protein–protein interaction (PPI) network analysis of DEPs identified via proteomic approaches based on TMT labelling was performed by Cytoscape software. Red nodes represent upregulated DEPs, and green nodes represent downregulated DEPs. (h) Western blotting analysis of indicated proteins was performed to validate the MS results. *p < 0.05. (i) Functional enrichment analysis of hub proteins from MC-derived EVs were carried out with the Genemania online tool. Red lines indicate physical interactions between proteins, and blue lines denote co-localization between proteins. The inner circle (stripes) shows pasted hub proteins, and the outer circle shows relevant proteins inferred from the literature. Coloured circles refer to the five most significant functions associated with proteins. (j) Schematic diagram representation of subcellular distribution of proteins that were enriched in several significant pathways. The size of circles refers to the expression levels of proteins identified by mass spectrometry. The colour of circles represents the pathways that were enriched.
Figure 4.
Figure 4.
Comparison of BMMC-derived EVs with published MCs EVs data in the proteome. (a) Venn diagram of total proteins from all identified BMMC-derived EVs proteins and the EVpedia and Vesiclepedia databases, showing common and unique proteins. (b) Enriched direct protein–protein interaction network from common proteins. (c) Distribution of these molecules mapping to other cells. Functional classification of the common exosomal proteins annotated by Gene Ontology. Pie charts represent the assigned classification of (d) cellular components, (e) molecular functions and (f) biological process. (g) The transcription factors associated with these overlapped proteins were analysed by FunRich. KLF7, SP1, YY1, MAF, NFE2 and JUND were significantly expressed among overlapped EVs proteins (p < 0.001).
Figure 5.
Figure 5.
Characteristics of lncRNAs encapsulated in MC-derived EVs. (a) Distribution of lncRNAs along each chromosome for each sample generated using Circos. (b) Distribution of five types of lncRNAs, including sense, antisense, intergenic, processed transcript, intronic and sense overlapping lncRNAs. (c) Length distribution of lncRNAs. (d) The heat map of differentially expressed (DE) lncRNAs between Rest-EV and Sti-EV groups, and the functional descriptions of 7 DE-lncRNAs of interest are shown (left panel). Each row represents a lncRNA, and each column represents a sample. Blue indicates downregulated and red indicates upregulated. (e) Expression levels of lncRNAs across the two groups. The expression levels are normalized to log2RPKM. (f) Expression analysis of DE-lncRNAs by qRT-PCR. The relative gene expression levels as expressed by 2–△△Ct were determined separately for each treatment as the mean ± SEM, *p < 0.05, **p < 0.01, and ***p < 0.001. (g) The validation of selected DE-lncRNAs indicated that the results from RNA sequencing in general agreed well with the qRT-PCR results.
Figure 6.
Figure 6.
Profiling of small RNAs in resting and degranulated MC-derived EVs (Rest-EV and Sti-EV) samples. (a) Principal components analysis of the total detected miRNAs in Rest-EV and Sti-EV. (b) A count of the mapped reads of small RNAs. (c) Pie charts of the expression distribution of different classes of sRNAs (miRNA, tRNA, snoRNA, snRNA, and rRNA) in MC-derived EVs. (d) Length distribution of detected small RNAs. Orange represents the raw reads, and light blue represents the mapped reads in the genome. (e) Heatmap generated by clustering of the differential expressed (DE) miRNAs in Rest-EV and Sti-EV. Red: up-regulation; purple: down-regulation (f) The scatter plot of miRNAs. (g) The expression levels for eight DE miRNAs were detected by qRT-PCR. *p < 0.05, **p < 0.01 and ***p < 0.001. Data are presented as mean ± SEM. (h) Comparison of different expression values detected by RNA-Seq and qRT-PCR for eight DE miRNAs. (i) Comparison of the number of DE miRNA-regulated target genes with evidence from PubMed. More than 50 target genes of miRNA (bold fonts).

References

    1. Li Z, Liu S, Xu J, et al. Adult connective tissue-resident mast cells originate from late erythro-myeloid progenitors. Immunity. 2018. October 16;49(4):640–653 e5. PubMed PMID: 30332630. - PubMed
    1. Yanez-Mo M, Siljander PR, Andreu Z, et al. Biological properties of extracellular vesicles and their physiological functions. J Extracell Vesicles. 2015;4:27066 PubMed PMID: 25979354; PubMed Central PMCID: PMCPMC4433489. - PMC - PubMed
    1. Robbins PD, Morelli AE.. Regulation of immune responses by extracellular vesicles. Nat Rev Immunol. 2014. March;14(3):195–20. PubMed PMID: 24566916; PubMed Central PMCID: PMCPMC4350779. - PMC - PubMed
    1. Merluzzi S, Betto E, Ceccaroni AA, et al. Mast cells, basophils and B cell connection network. Mol Immunol. 2015. January;63(1):94–103. PubMed PMID: 24671125. - PubMed
    1. Li F, Wang Y, Lin L, et al. Mast cell-derived exosomes promote Th2 cell differentiation via OX40L-OX40 ligation. J Immunol Res. 2016;2016:3623898 PubMed PMID: 27066504; PubMed Central PMCID: PMCPMC4811108. - PMC - PubMed

LinkOut - more resources