. 2019 Nov 19;10(12):6351-6369.
doi: 10.1364/BOE.10.006351. eCollection 2019 Dec 1.

Learned sensing: jointly optimized microscope hardware for accurate image classification

Affiliations

Learned sensing: jointly optimized microscope hardware for accurate image classification

Alex Muthumbi et al. Biomed Opt Express. .

Abstract

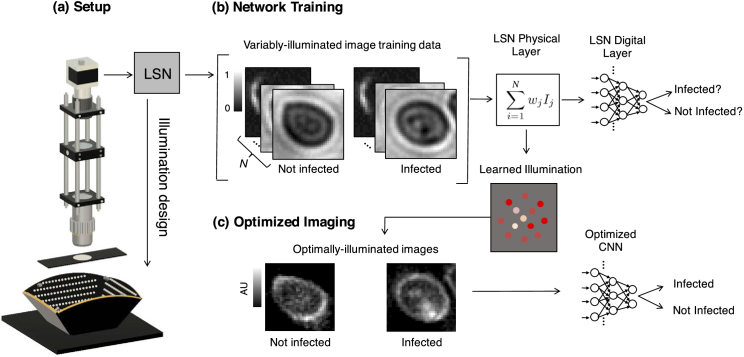
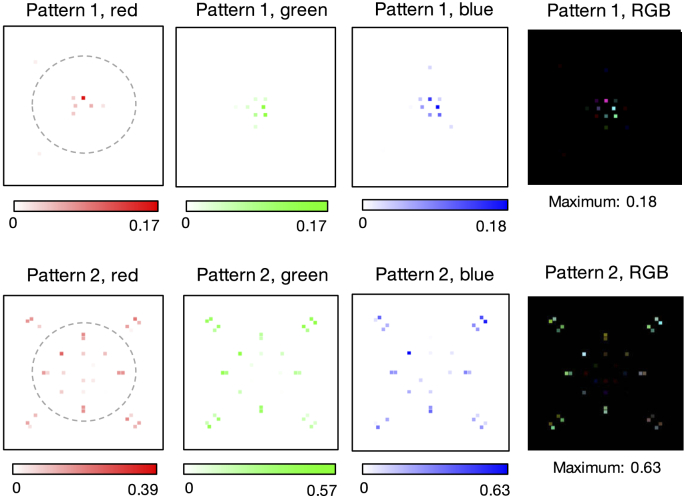
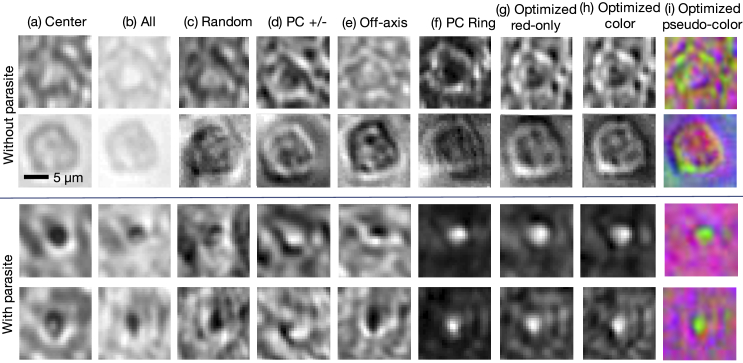
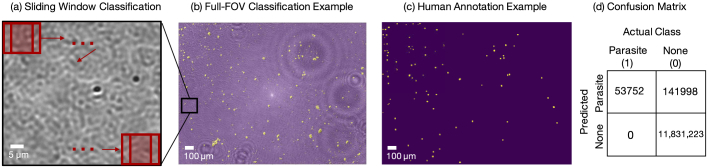
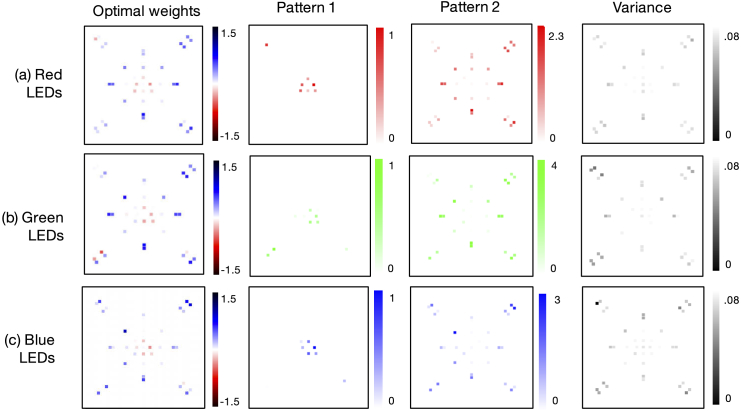
Since its invention, the microscope has been optimized for interpretation by a human observer. With the recent development of deep learning algorithms for automated image analysis, there is now a clear need to re-design the microscope's hardware for specific interpretation tasks. To increase the speed and accuracy of automated image classification, this work presents a method to co-optimize how a sample is illuminated in a microscope, along with a pipeline to automatically classify the resulting image, using a deep neural network. By adding a "physical layer" to a deep classification network, we are able to jointly optimize for specific illumination patterns that highlight the most important sample features for the particular learning task at hand, which may not be obvious under standard illumination. We demonstrate how our learned sensing approach for illumination design can automatically identify malaria-infected cells with up to 5-10% greater accuracy than standard and alternative microscope lighting designs. We show that this joint hardware-software design procedure generalizes to offer accurate diagnoses for two different blood smear types, and experimentally show how our new procedure can translate across different experimental setups while maintaining high accuracy.


Conflict of interest statement

The authors declare that there are no conflicts of interest related to this article.

Figures

Fig. 1.
Fig. 1.
We present a learned sensing network (LSN), which optimizes a microscope’s illumination to improve the accuracy of automated image classification. (a) Standard optical microscope outfitted with an array of individually controllable LEDs for illumination. (b) Network training is accomplished with a large number of training image stacks, each containing N uniquely illuminated images. The proposed network’s physical layer combines images within a stack via a weighted sum before classifying the result, where each weight corresponds to the relative brightness of each LED in the array. (c) After training, the physical layer returns an optimized LED illumination pattern that is displayed on the LED array to improve classification accuracies in subsequent experiments.
Fig. 2.
Fig. 2.
Optimal single-color illumination patterns determined by our network for thin-smear malaria classification (average over 15 trials). (a) Optimized LED arrangement determined using only the red spectral channel exhibits negative (Pattern 1) and positive (Pattern 2) weights that lead to two LED patterns to display on the LED array, recording two images which are then subtracted. Variance over 15 independent runs of the network’s algorithm shows limited fluctuation in the optimized LED pattern. (b-c) Same as (a), but using only the green and blue spectral channels, respectively, for the classification optimization. Dashed line denotes bright-field/dark-field cutoff.
Fig. 3.
Fig. 3.
Optimal multispectral illumination patterns determined by our network for thin-smear malaria classification (average over 15 trials). Learned sensing optimization is jointly performed here over 3 LED colors and 28 LED locations simultaneously, yielding 2 unique spatio-spectral patterns that produce 2 optimally illuminated images for subtraction.
Fig. 4.
Fig. 4.
Example images of individual thin-smear blood cells under different forms of illumination. Top two rows are negative examples of cells that do not include a malaria parasite, bottom two rows are positive examples that contain the parasite. Example illuminations include from (a) just the center LED, (b) uniform light from all LEDs, (c) all LEDs with uniformly random brightnesses, (d) a phase contrast-type (PC) arrangement, (e) an off-axis LED, (f) a phase contrast (PC) ring, (g) optimized pattern with red illumination, (h) optimized multispectral pattern, and (i) the same as in (h) but showing response to each individual LED color in pseudo-color, to highlight color illumination’s effect at different locations across the sample.
Fig. 5.
Fig. 5.
Optimal multispectral illumination patterns determined by the learned sensing network for thick-smear malaria classification. Network optimization is jointly performed over 3 LED colors and 40 locations simultaneously. Dashed line denotes bright-field/dark-field cutoff. Optimized pattern uses a similar phase contrast mechanism as with the thin smear, but converges towards a distinctly unique spatial pattern and multispectral profile.
Fig. 6.
Fig. 6.
Example images of thick-smear locations under different forms of illumination. Top two rows are negative examples of areas that do not include a malaria parasite, bottom two rows are positive examples that contain the parasite. Example illuminations for (a)–(f) mirror those from Fig. 4, while the optimized patterns used for (h)–(i) are shown in Fig. 5.
Fig. 7.
Fig. 7.
Full-slide classification performance using a pre-trained learned sensing network with a new experimental setup. (a) Zoom-in of a thick smear image captured in Durham, NC with sliding window classification process depicted on the top. (b) Classification map (in yellow) overlayed on top of the experimental image of the thick smear. Here the classification map for the entire thick smear image was generated by the sliding-window technique, using the learned-sensing CNN trained on the data captured in Erlangen, Germany. (c) Human annotation map of same thick smear. (d) Confusion matrix of classification performance.
Fig. 8.
Fig. 8.
Optimal single-color illumination patterns determined by our network for thick-smear malaria classification (average over 15 trials). (a) Optimized LED arrangement determined using only the red spectral channel has (Pattern 1) negative and (Pattern 2) positive weights that lead to two LED patterns to display while capturing and subtracting two images. Variance over 15 independent runs. (b-c) Same as (a), but using only the green and blue spectral channels, respectively, for optimization.

References

    1. LeCun Y., Bengio Y., Hinton G., “Deep learning,” Nature 521(7553), 436–444 (2015).10.1038/nature14539 - DOI - PubMed
    1. Buggenthin F., Buettner F., Hoppe P. S., Endele M., Kroiss M., Strasser M., Schwarzfischer M., Loeffler D., Kokkaliaris K. D., Hilsenbeck O., Schroeder T., Theis F. J., Marr C., “Prospective identification of hematopoietic lineage choice by deep learning,” Nat. Methods 14(4), 403–406 (2017).10.1038/nmeth.4182 - DOI - PMC - PubMed
    1. Eulenberg P., Köhler N., Blasi T., Filby A., Carpenter A. E., Rees P., Theis F. J., Wolf F. A., “Reconstructing cell cycle and disease progression using deep learning,” Nat. Commun. 8(1), 463 (2017).10.1038/s41467-017-00623-3 - DOI - PMC - PubMed
    1. Esteva A., Kuprel B., Novoa R. A., Ko J., Swetter S. M., Blau H. M., Thrun S., “Dermatologist-level classification of skin cancer with deep neural networks,” Nature 542(7639), 115–118 (2017).10.1038/nature21056 - DOI - PMC - PubMed
    1. Apthorpe N., Riordan A., Aguilar R., Homann J., Gu Y., Tank D., Seung H. S., “Automatic neuron detection in calcium imaging data using convolutional networks,” in Advances in Neural Information Processing Systems 29, Lee D. D., Sugiyama M., Luxburg U. V., Guyon I., Garnett R., eds. (Curran Associates, Inc., 2016), pp. 3270–3278.

LinkOut - more resources