. 2019 Oct;6(4):045011.
doi: 10.1117/1.NPh.6.4.045011. Epub 2019 Dec 10.

Mapping cortical network effects of fatigue during a handgrip task by functional near-infrared spectroscopy in physically active and inactive subjects

Affiliations

Mapping cortical network effects of fatigue during a handgrip task by functional near-infrared spectroscopy in physically active and inactive subjects

Elizabeth L Urquhart et al. Neurophotonics. 2019 Oct.

Abstract

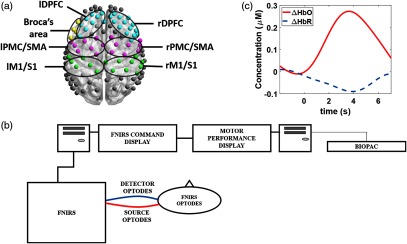
The temporal evolution of cortical activation and connectivity patterns during a fatiguing handgrip task were studied by functional near-infrared spectroscopy (fNIRS). Twenty-three young adults (18 to 35 years old) were recruited to use a handheld force sensor to perform intermittent handgrip contractions with their dominant hand at their personal maximum voluntary contraction force level for 3.5 s followed by 6.5 s of rest for 120 blocks. Subjects were divided into self-reported physically active and inactive groups, and their hemodynamic activity over the prefrontal and sensory-motor cortices (111 channels) was mapped while they performed this task. Using this fNIRS setup, a more detailed time sequence of cortical activation and connectivity patterns was observed compared to prior studies. A temporal evolution sequence of hemodynamic activation patterns was noted, which was different between the active and the inactive groups. Physically active subjects demonstrated delayed fatigue onset and significantly longer-lasting and more spatially extended functional connectivity (FC) patterns, compared to inactive subjects. The observed differences in activation and FC suggested differences in cortical network adaptation patterns as fatigue set in, which were dependent on subjects' physical activity. The findings of this study suggest that physical activity increases FC with regions involved in motor task control and correlates to extended fatigue onset and enhanced performance.

Keywords: cardiovascular health; fatigue; functional connectivity; functional near-infrared spectroscopy; handgrip exercise; prefrontal cortex; sensory-motor cortex.


Figures

Fig. 1
Fig. 1
Experimental setup and protocol timeline for the handgrip task. (a) The fNIRS multichannel layout with 111 channels covering five ROIs: M1/S1 (green), PMC (red), DLPFC (blue), and Broca’s area (yellow). All other channels, located over the temporal and occipital lobes are shown in gray. (b) Schematic representation of the experimental setup of the fNIRS system (LABNIRS) and the BIOPAC handgrip force sensor system with one representative source–detector channel shown for simplicity. (c) ΔHbO and ΔHbR hemodynamic responses at lM1/S1 for the first 10 blocks of the task.
Fig. 2
Fig. 2
Force produced during intermittent handgrip contractions at 100% MVC force level using the dominant hand for physically inactive (light gray) and active subjects (dark gray). Each data point represents an average of 60 consecutive trials, expressed as the mean (bar height) ±standard error to the mean (SEM; error bar). Circles: individual performance. *p<0.01; **p<0.001.
Fig. 3
Fig. 3
ROIs of statistically significant activity for inactive subject’s at (a) 0 to 100 s, (b) 1 to 10 min, and (c) 11 to 20 min and for active subjects at (d) 0 to 100 s, (e) 1 to 10 min, and (f) 10 to 20 min of the handgrip task. Only ROIs with statistically significant (p<0.05, FDR corrected) activation are shown with corresponding t-values next to it (red ovals—activation; blue ovals—deactivation). No significant group differences seen early in the handgrip task at (g) 0 to 100 s, and greater activation in few regions was seen for active subjects (red ovals; negative t-values) over longer time intervals; (h) 0 to 10 min, and (i) 10 to 20 min. With the exception of (h) and (i), all positive t-values corresponded to activation (red ovals) and all negative t-values corresponded to deactivation (blue ovals).
Fig. 4
Fig. 4
Evolution of FC patterns during the entire handgrip task with the seed region at lM1 for inactive subjects at (a) baseline, (b) 0 to 10 min, and (c) 10 to 20 min and for active subjects at (d) baseline, (e) 0 to 10 min, and (f) 10 to 20 min. The black oval encircles the seed region channels and is only displayed at baseline for clarity. Only regions with statistically significant FC strength are shown (p<0.05, Bonferroni-corrected).
Fig. 5
Fig. 5
Evolution of FC patterns during the entire handgrip task with the seed region at lDLPFC for inactive subjects at (a) baseline, (b) 0 to 10 min, and (c) 10 to 20 min, and for active subjects at (d) baseline, (e) 0 to 10 min, and (f) 10 to 20 min. The black oval encircles the seed region channels and is only displayed at baseline for clarity. Only regions with statistically significant FC strength are shown (p<0.05, Bonferroni-corrected).
Fig. 6
Fig. 6
Evolution of FC patterns during the entire handgrip task with the seed region at rDLPFC for inactive subjects at (a) baseline, (b) 0 to 10 min, and (c) 10 to 20 min, and for active subjects at (d) baseline, (e) 0 to 10 min, and (f) 10 to 20 min. The black oval encircles the seed region channels and is only displayed at baseline for clarity. Only regions with statistically significant FC strength are shown (p<0.05, Bonferroni-corrected).

References

    1. Mueller P. J., et al. , “Integration of central and peripheral regulation of the circulation during exercise: acute and chronic adaptations,” Compr. Physiol. 8(1), 103–151 (2017).10.1002/cphy.c160040 - DOI - PubMed
    1. Gonzalez-Alonso J., et al. , “Brain and central haemodynamics and oxygenation during maximal exercise in humans,” J. Physiol. 557(1), 331–342 (2004).JPHYA710.1113/jphysiol.2004.060574 - DOI - PMC - PubMed
    1. Liu J. Z., et al. , “Shifting of activation center in the brain during muscle fatigue: an explanation of minimal central fatigue?” Neuroimage 35(1), 299–307 (2007).NEIMEF10.1016/j.neuroimage.2006.09.050 - DOI - PMC - PubMed
    1. Shibuya K., Kuboyama N., “Decreased activation in the primary motor cortex area during middle-intensity hand grip exercise to exhaustion in athlete and nonathlete participants,” Percept. Mot. Skills 111(1), 19–30 (2010).10.2466/15.25.26.PMS.111.4.19-30 - DOI - PubMed
    1. Wong S. W., et al. , “Sex differences in forebrain and cardiovagal responses at the onset of isometric handgrip exercise: a retrospective fMRI study,” J. Appl. Physiol. 103(4), 1402–1411 (2007).10.1152/japplphysiol.00171.2007 - DOI - PubMed