Review
. 2019 Dec 18;10(1):121.
doi: 10.1186/s13244-019-0801-z.

Assessment of hepatocellular carcinoma treatment response with LI-RADS: a pictorial review

Affiliations
Review

Assessment of hepatocellular carcinoma treatment response with LI-RADS: a pictorial review

Nicolas Voizard et al. Insights Imaging. .

Abstract

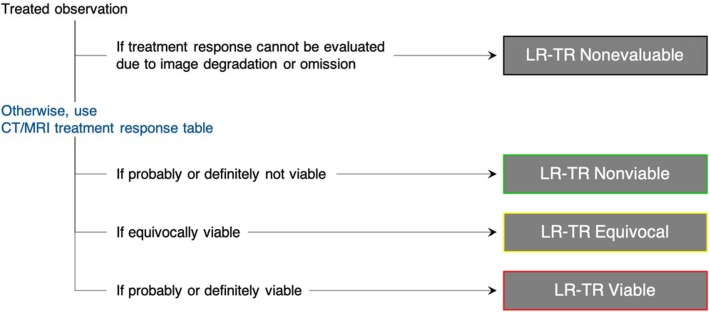
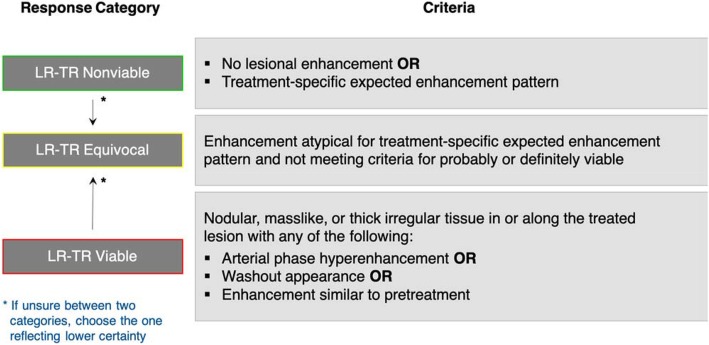
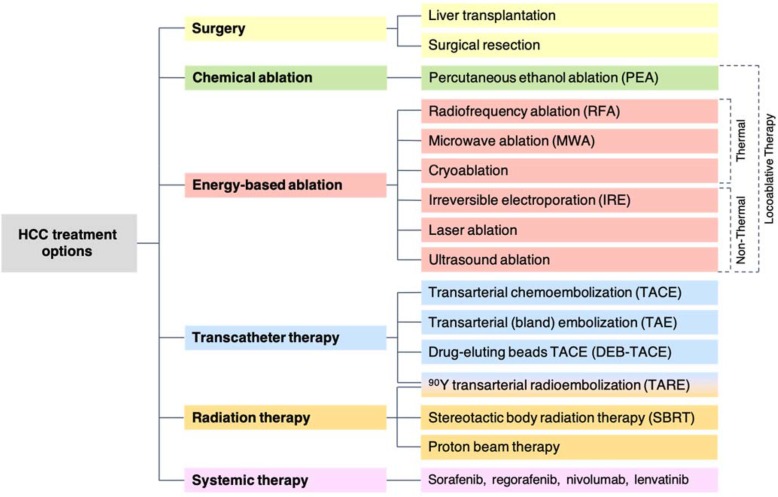
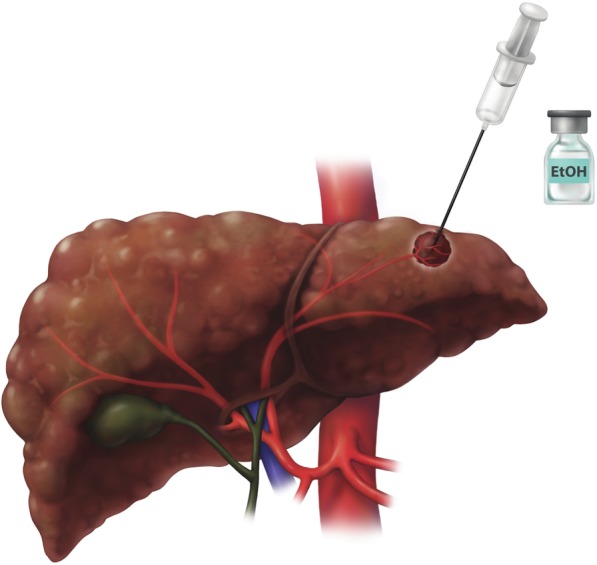
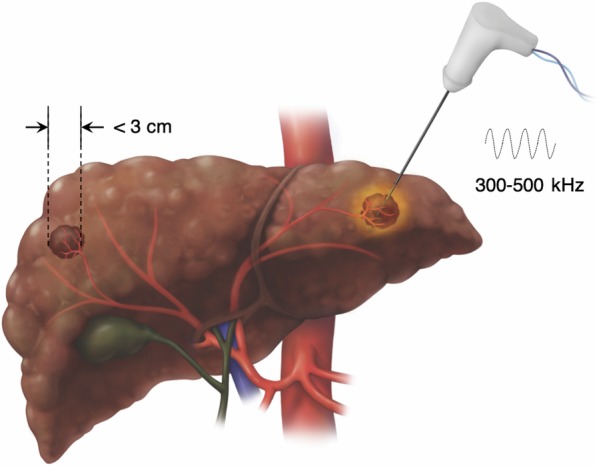
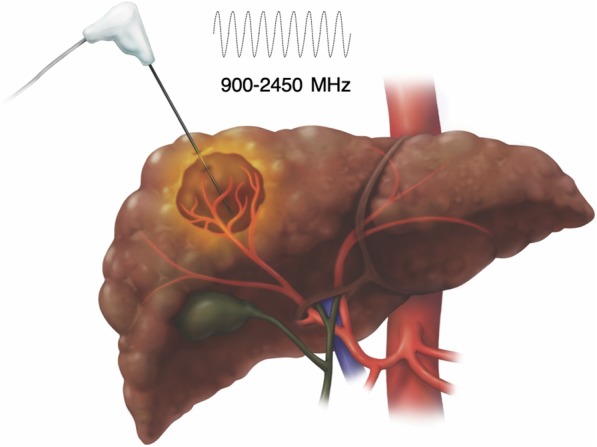
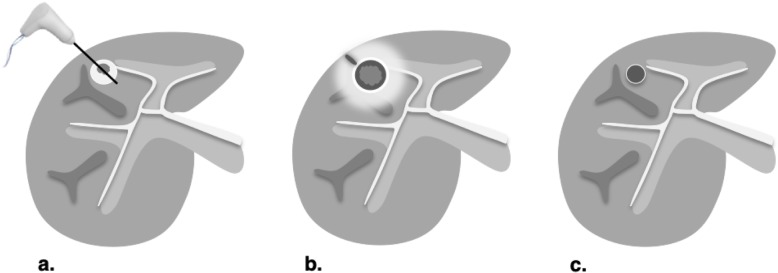
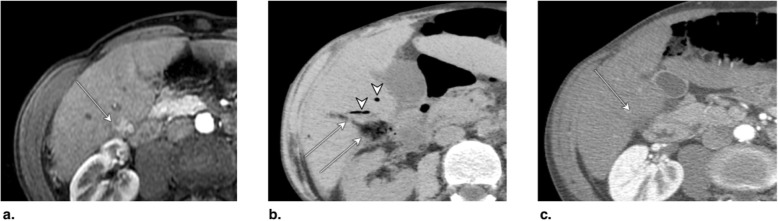
Computed tomography (CT) and magnetic resonance imaging (MRI) play critical roles for assessing treatment response of hepatocellular carcinoma (HCC) after locoregional therapy. Interpretation is challenging because posttreatment imaging findings depend on the type of treatment, magnitude of treatment response, time interval after treatment, and other factors. To help radiologists interpret and report treatment response in a clear, simple, and standardized manner, the Liver Imaging Reporting and Data System (LI-RADS) has developed a Treatment Response (LR-TR) algorithm. Introduced in 2017, the system provides criteria to categorize response of HCC to locoregional treatment (e.g., chemical ablation, energy-based ablation, transcatheter therapy, and radiation therapy). LR-TR categories include Nonevaluable, Nonviable, Equivocal, and Viable. LR-TR does not apply to patients on systemic therapies. This article reviews the LR-TR algorithm; discusses locoregional therapies for HCC, treatment concepts, and expected posttreatment findings; and illustrates LI-RADS treatment response assessment with CT and MRI.

Keywords: Computed tomography; Hepatocellular carcinoma; LI-RADS Treatment Response; LIRADS; Locoregional; Magnetic resonance imaging.


Conflict of interest statement

The authors declare that they have no competing interests.

Figures

Fig. 1
Fig. 1
LI-RADS CT/MRI Treatment Response algorithm. Reprinted, with permission, from ACR [5]
Fig. 2
Fig. 2
LI-RADS CT/MRI Treatment Response criteria and tiebreaking rule. Diagram created by authors. Adapted and reprinted, with permission, from ACR [5]
Fig. 3
Fig. 3
Hepatocellular carcinoma (HCC) treatment options divided by modality. Locoablative therapies (PEA, RFA, MWA), transcatheter therapies (TAE, TACE, DEB-TACE, TARE) and radiation therapies (SBRT) are the most commonly used locoregional treatments for HCC treatment and are reviewed in this article
Fig. 4
Fig. 4
Percutaneous ethanol ablation (PEA). Absolute ethanol is injected in the tumor. Multiple sessions and prolonged treatment time may be required
Fig. 5
Fig. 5
Radiofrequency ablation (RFA). Treatment is typically used to treat hepatocellular carcinomas under 3 cm in a non-perivascular location
Fig. 6
Fig. 6
Microwave ablation (MWA). Compared to radiofrequency ablation, larger tumors can be targeted in shorter treatment duration even in perivascular locations
Fig. 7
Fig. 7
Expected treatment response after percutaneous ethanol ablation (PEA), radiofrequency ablation (RFA) and microwave ablation (MWA). Axial contrast-enhanced CT images of the liver obtained in late arterial phase are illustrated: a Pretreatment: RFA is used with curative intent of early-stage hepatocellular carcinoma (≤ 3 cm) in non-surgical patients. PEA is typically used when RFA is unsafe or contraindicated. MWA may target larger tumor with curative intent but additional studies are needed. Larger tumor (> 3 cm) may be targeted for downstaging purpose or as a bridging therapy prior to transplantation alone or in combination with other treatments. b 1–3 months posttreatment: Diameter of ablation zone at the time of treatment is usually 5 to 10 mm greater than the treated lesion. The following features may be seen: intratumoral gas foci up to 1 month posttreatment, thin linear peripheral enhancement along ablation zone, smooth rind or wedge-shaped parenchymal enhancement around ablation zone, intralesional hyperdensity/intensity on unenhanced CT or on T1-weighted MRI (reflecting coagulation necrosis), and hypodense liver parenchyma may be seen along needle trajectory. c ≥ 6 months posttreatment: ablation zone involutes over time. Thin linear peripheral enhancement along ablation zone decreases. Parenchymal enhancement resolves. At any point posttreatment, presence of nodular arterial phase hyperenhancement, washout appearance, or enhancement similar to pretreatment indicates recurrence or residual viable tumor
Fig. 8
Fig. 8
a Axial T1-weighted MR in late arterial phase (AP) obtained pretreatment: image shows nonrim arterial phase hyperenhancement of a 2-cm LR-4 observation (arrow). b Axial-unenhanced CT MinIP obtained immediately post percutaneous ethanol ablation (PEA): image shows pneumobilia (arrowheads), ablation cavity, and needle trajectory (arrows). c Axial CT in late AP obtained 4 months post PEA: image shows no enhancement and cavity retraction (arrow). The treated observation is categorized LR-TR Nonviable
Fig. 9
Fig. 9
Axial CT in late arterial phase (AP) obtained (a) pretreatment: image shows nonrim arterial phase hyperenhancement (APHE) of a 2-cm LR-4 observation in segment II-III (arrow). b 2 months post percutaneous ethanol ablation (PEA): image shows interval growth (arrow) and a new LR-4 observation (arrowhead) in segment VIII. At this point, the treated lesion is categorized LR-TR viable. c Axial T1-weighted subtraction MR in late AP obtained 1 month post repeat PEA: image shows serpiginous enhancement in the location of the treated lesion possibly representing vascular fistula. The treated observation is categorized LR-TR Equivocal
Fig. 10
Fig. 10
a Axial CT in portal venous phase obtained pretreatment: image shows washout of a 2.5-cm LR-5 observation. Proximity to gallbladder and biliary bifurcation contraindicates radiofrequency ablation. Axial CT in late arterial phase obtained 1 month post percutaneous ethanol ablation: images show (b) hypoenhancement of the treatment area (arrow), with (c) nodular arterial phase hyperenhancement at the upper margin of the treated lesion indicating viable tumor (arrow). The treated observation is categorized LR-TR Viable
Fig. 11
Fig. 11
Axial CT obtained (a) pretreatment: image in late arterial phase (AP) shows nonrim arterial phase hyperenhancement of a small peripheral LR-5 observation (arrow). b Immediately post radiofrequency ablation (RFA): unenhanced image shows hyperdense central cavity related to coagulated blood products (arrow). c 3 months post RFA: image in late AP shows unenhanced and enlarged cavity with resorption of blood products. The treated observation is categorized LR-TR Nonviable
Fig. 12
Fig. 12
Axial T1-weighted fat-saturated MR in late arterial phase obtained (a) pretreatment: image shows nonrim arterial phase hyperenhancement (APHE) of a small HCC (arrow). b 1 month post radiofrequency ablation (RFA): image shows irregular rim enhancement and more nodular APHE at posterolateral margin (arrow). The treated observation is categorized LR-TR equivocal. c 4 months post RFA: image shows no suspicious enhancement; the treated observation is now categorized LR-TR Nonviable
Fig. 13
Fig. 13
Axial CT in late arterial phase obtained (a) pretreatment: image shows nonrim arterial phase hyperenhancement (APHE) of a right lobe LR-4 observation (arrow). b 2 months post radiofrequency ablation (RFA): image shows needle trajectory (arrowhead) and a treatment cavity (arrow) with no residual tumor. c 8 months post RFA: image shows irregular masslike APHE (arrowheads) posterior to the treatment zone. The treated observation is categorized LR-TR Viable
Fig. 14
Fig. 14
Axial CT in late arterial phase obtained (a) pretreatment: image shows nonrim arterial phase hyperenhancement (APHE) of a 2-cm observation in segment VII (arrow). b 6 weeks post microwave ablation (MWA): image shows large hypodense cavity (arrow) with margins covering the targeted lesion. c 6 months post MWA: image shows well-defined cavity (arrow) with decreased diameter and no APHE. The treated observation is categorized LR-TR Nonviable
Fig. 15
Fig. 15
Axial T1-weighted fat-saturated MR in late arterial phase obtained (a) pretreatment: image shows arterial phase hyperenhancement (APHE) of a 18-mm LR-5 observation (arrow). b 6 weeks post microwave ablation (MWA): image shows two nonspecific APHE perilesional nodules possibly representing perfusional changes (arrowhead). At this point, treated observation is categorized LR-TR equivocal. c 3 months post MWA: image shows disappearance of nodules in treatment zone; the treated observation is now categorized LR-TR Nonviable
Fig. 16
Fig. 16
Axial CT in late arterial phase obtained (a) pretreatment: image shows nonrim arterial phase hyperenhancement (APHE) of a 2.8-cm LR-5 observation in segment VIII (arrow) of a patient with prior left hepatectomy. b 6 weeks post microwave ablation (MWA): image shows hypodense cavity with peripheral thick nodular APHE (arrow). c 3 months post MWA: image shows thick nodular APHE (arrow). The treated observation is categorized LR-TR Viable
Fig. 17
Fig. 17
Transcatheter therapy. Tumor arterial blood supply is selectively catheterized to deliver embolic material, chemotherapeutic agent, or radioactive beads
Fig. 18
Fig. 18
Technically similar, transcatheter therapies greatly differ by the composition of the injection. a Transarterial chemoembolization (TACE) uses an emulsion of ethiodized oil and chemotherapy. b Transarterial (bland) embolization (TAE) relies solely on bland embolic material to treat the tumor. c Drug-eluting beads (DEB-TACE) are loaded with chemotherapeutic agent allowing prolonged delivery. d Transarterial radioembolization (TARE) delivers β-emitting microspheres. Note the greater diffusion of administered agents in the tumors with TARE compared to other transcatheter techniques
Fig. 19
Fig. 19
Expected treatment response after transarterial chemoembolization (TACE). Axial contrast-enhanced CT images of the liver obtained in late arterial phase are illustrated: Note: the wedge-shaped hyperdensity on illustrations b and c reflects the non-target parenchymal ethiodized oil deposition, not enhancement. a Pretreatment: typically used for bridging, debulking, or palliative treatment in patients with intermediate-stage hepatocellular carcinoma without vascular invasion. May be used alone or in combination with other treatments. b 1–3 months posttreatment: hyperdensity on unenhanced CT reflects ethiodized oil agent deposition in the tumor and at its periphery and reflects distribution of the embolic material. Ethiodized oil limits assessment of viability on CT. MRI helps assessment as oil agent does not mask enhancement. The following features may be seen: thin uniform rim enhancement around the treated zone, regional parenchymal enhancement, and intratumoral gas foci (up to 4–6 weeks posttreatment). c ≥ 6 months posttreatment: density and extent of ethiodized oil retention decreases with time. Size of necrotic zone decreases over time. Regional parenchymal enhancement resolves. Rim enhancement around the treated zone may persist for months to years. At any point posttreatment, presence of nodular arterial phase hyperenhancement, washout appearance, or enhancement similar to pretreatment indicates recurrence or residual viable tumor
Fig. 20
Fig. 20
Expected treatment response after transarterial bland embolization (TAE) and drug-eluting beads transarterial chemoembolization (DEB-TACE). Axial contrast-enhanced CT images of the liver obtained in late arterial phase are illustrated: a Pretreatment: typically used for bridging, debulking, or palliative treatment in patients with intermediate-stage hepatocellular carcinoma without vascular invasion. May be used alone or in combination with other treatments. b 1–3 months posttreatment: TAE and DEB-TACE show similar posttreatment evolution since drug-eluting beads are not visible on imaging. Contrary to TACE, since no hyperdense ethiodized oil is used, tumor viability is easier to assess on CT. The same following features as TACE may be seen: thin uniform rim enhancement around the treated zone, regional parenchymal enhancement, and intratumoral gas foci (up to 4–6 weeks posttreatment). c ≥ 6 months posttreatment: size of necrotic zone decreases over time. Regional parenchymal enhancement resolves. Rim enhancement along the treated zone may persist for months to years. At any point posttreatment, presence of nodular arterial phase hyperenhancement, washout appearance, or enhancement similar to pretreatment indicates recurrence or residual viable tumor
Fig. 21
Fig. 21
a Axial T1-weighted MR in late arterial phase (AP) obtained pretreatment: image shows nonrim arterial phase hyperenhancement (APHE) of a 3-cm LR-5 observation in segments II-III (arrow). b Unenhanced axial CT obtained immediately post transarterial chemoembolization (TACE) of segment III: image shows suboptimal targeting with incomplete ethiodized oil retention (arrow). c Unenhanced axial CT obtained post repeat TACE: image shows extended treatment area with optimal targeting (arrow). Postcontrast imaging (not shown) did not show APHE or washout, the treated observation is categorized LR-TR Nonviable
Fig. 22
Fig. 22
Axial CT obtained (a) pretreatment: image in late arterial phase (AP) shows nonrim arterial phase hyperenhancement of a 3.5-cm LR-5 observation in segment VI (arrow). b 1 month post transarterial chemoembolization (TACE): image in portal venous phase shows ethiodized oil retention with optimal targeting (arrow). c 2 months post TACE: image in late AP shows decrease of ethiodized oil retention (arrow). Density of ethiodized oil limits the assessment at the anterior part of the lesion. The treated observation is categorized LR-TR Equivocal
Fig. 23
Fig. 23
a Axial CT in portal venous phase obtained pretreatment: image shows washout of a 4.8-cm LR-5 observation in segment VIII (arrow). b Immediately post transarterial chemoembolization (TACE) of right hepatic artery: unenhanced image shows diffuse ethiodized oil retention of the right lobe (asterisks). c Axial T1-weighted MR in late AP obtained 4 months post TACE: image shows a 3-cm hyperenhancing nodule at the anterior aspect of the treated lesion. The treated observation is categorized LR-TR Viable
Fig. 24
Fig. 24
Axial T1-weighted MR in late arterial phase obtained (a) pretreatment: image shows two LR-4 observations (arrows) with nonrim arterial phase hyperenhancement (APHE). b 2 months post drug-eluting beads TACE (DEB-TACE): image shows regional APHE (asterisk). c 10 months post DEB-TACE: image shows decrease in regional APHE (asterisk). No nodular enhancement nor washout is visible. The treated observation is categorized LR-TR nonviable. Note the radiofrequency ablation cavity of another treated lesion (arrowhead)
Fig. 25
Fig. 25
Axial CT in late arterial phase obtained (a) pretreatment: image shows arterial phase hyperenhancement (APHE) of a nodule (arrow) within previous drug-eluting beads TACE (DEB-TACE) treatment zone. b 1 month post repeat DEB-TACE: image shows APHE of a 3 mm focus (arrow) at periphery of treatment zone. At this point, the treated observation is categorized LR-TR equivocal. c 4 months post repeat DEB-TACE: image shows enlarging 14 mm nodular APHE (arrow) at periphery of treatment zone. The treated observation is now categorized LR-TR Viable
Fig. 26
Fig. 26
Axial CT obtained (a) pretreatment: image in portal venous phase shows enhancing “capsule” and washout of a LR-5 observation in segment VII. b 4 months post drug-eluting beads TACE (DEB-TACE): image in late arterial phase shows thicker peripheral arterial phase hyperenhancement (arrow). The treated observation is categorized LR-TR viable. The lesion was subsequently treated with transarterial chemoembolization (TACE). c Axial-unenhanced CT post TACE: image shows the expected ethiodized oil retention (arrow)
Fig. 27
Fig. 27
Stereotactic body radiotherapy (SBRT). The tumor is targeted by static conformal beams matching tumor shape and limiting radiation dose to adjacent organs and non-target liver
Fig. 28
Fig. 28
Expected treatment response after stereotactic body radiotherapy (SBRT) and transarterial radioembolization (TARE). Axial contrast-enhanced CT of the liver obtained in late arterial phase are illustrated: a Pretreatment: typically used for bridging, debulking, or palliative treatment in patients with intermediate- to advanced-stage hepatocellular carcinoma. May be used alone or in combination with other treatments. SBRT may be used as an alternative to RFA for early-stage HCC. With SBRT, lesions should be located away from critical organs. Before TARE, 99mTc-MAA scan is performed to determine radiation dose to be delivered to tumor/non-tumor areas and identify shunting. b 1–3 months posttreatment: intralesional nodular arterial phase hyperenhancement and washout may persist but should gradually fade as radiation necrosis progresses. Geographic enhancing region surrounding the treated zone may represent inflammatory hyperemia, venous congestion, and radiation fibrosis and could be misinterpreted as infiltrative disease. With SBRT, tumor size and enhancement may transiently increase during the first weeks posttreatment, a phenomenon called pseudoprogression. c ≥ 6 months posttreatment: treated zone shrinks as fibrosis progresses and is associated with capsular retraction. Intralesional enhancement and washout appearance may persist but usually resolves after 6 months. Late venous enhancement in the irradiated non-tumorous parenchyma may still be observed. Washout may help differentiate radiation-induced changes from tumor progression. An increase in enhancement or in washout appearance after an initial favorable response suggests recurrence
Fig. 29
Fig. 29
Axial T1-weighted MR obtained (a) pretreatment: image in late arterial phase shows hyperenhancement of a 2.5 cm LR-5 observation. b 6 months post stereotactic body radiotherapy (SBRT): image in portal venous phase shows persistent 7-mm nodular enhancement (arrow), perfusional anomalies (asterisk), and capsular retraction. c 1 year post SBRT: image in portal venous phase shows absence of nodular enhancement and persistent but decreased perfusional anomalies. The treated observation is categorized LR-TR Nonviable
Fig. 30
Fig. 30
Axial T1-weighted MR in late arterial phase (AP) obtained (a) pretreatment: image shows recurrence (arrow) of a lesion previously treated with radiofrequency and transarterial chemoembolization (TACE) (arrowheads). b 2 months post stereotactic body radiotherapy (SBRT): image shows incomplete tumor regression. c Axial CT in late AP obtained 5 months post SBRT: image shows faint residual enhancement (arrow) that may represent expected enhancement pattern. The treated observation is categorized LR-TR equivocal. Note the ethiodized oil retention from previous TACE (arrowhead)
Fig. 31
Fig. 31
a Axial T1-weighted MR in portal venous phase obtained pretreatment: image shows washout of a 2.5 cm LR-5 observation in caudate lobe (arrow). b Axial CT in late arterial phase (AP) obtained 3 months post stereotactic body radiotherapy (SBRT): image shows tumor progression (arrowheads) and perfusional anomalies related to edema (asterisk). Mural thrombus in inferior vena cava is noted (arrow). The treated observation is categorized LR-TR viable. c Axial CT in late AP obtained 6 months posttreatment: image shows diffuse tumoral infiltration of left lobe (arrow)
Fig. 32
Fig. 32
Axial T1-weighted MR obtained (a) pretreatment: image in late arterial phase (AP) shows a 5-cm LR-5 observation (arrow). b 1 month post transarterial radioembolization (TARE): image in portal venous phase shows hypoenhancing area. c 1 year post TARE: image in late AP shows expected capsular retraction and perfusional anomalies (asterisk). The treated observation is categorized LR-TR Nonviable
Fig. 33
Fig. 33
Axial CT in late arterial phase obtained (a) pretreatment: image shows an enhancing 6-cm LR-5 observation in segment VI (arrows). b 1 month post transarterial radioembolization (TARE): image shows no change. c 6 months post TARE: image shows atrophy and diffuse enhancement of segment VI, hypoenhancement at the anterior aspect of the lesion and faint posterior enhancement (arrowhead). These changes may represent treatment-specific expected enhancement pattern or residual tumor. The treated observation is categorized LR-TR Equivocal
Fig. 34
Fig. 34
Axial CT in late arterial phase obtained (a) pretreatment: image shows a 4-cm LR-5 observation (arrow) in segment IVa. b 3 months post left lobar transarterial radioembolization (TARE): image shows tumor regression and perfusional changes in left liver (asterisk) related to TARE. c 6 months post TARE: image shows tumor progression (arrow) compatible with recurrence. The treated observation is categorized LR-TR Viable

References

    1. Villanueva A. Hepatocellular carcinoma. N Engl J Med. 2019;380:1450–1462. doi: 10.1056/NEJMra1713263. - DOI - PubMed
    1. Kielar Ania, Fowler Kathryn J., Lewis Sara, Yaghmai Vahid, Miller Frank H., Yarmohammadi Hooman, Kim Charles, Chernyak Victoria, Yokoo Takeshi, Meyer Jeffrey, Newton Isabel, Do Richard K. Locoregional therapies for hepatocellular carcinoma and the new LI-RADS treatment response algorithm. Abdominal Radiology. 2017;43(1):218–230. doi: 10.1007/s00261-017-1281-6. - DOI - PMC - PubMed
    1. Tang An, Fowler Kathryn J., Chernyak Victoria, Chapman William C., Sirlin Claude B. LI-RADS and transplantation for hepatocellular carcinoma. Abdominal Radiology. 2017;43(1):193–202. doi: 10.1007/s00261-017-1210-8. - DOI - PubMed
    1. Chernyak V, Fowler KJ, Kamaya A, et al. Liver Imaging Reporting and Data System (LI-RADS) version 2018: imaging of hepatocellular carcinoma in at-risk patients. Radiology. 2018;289:816–830. doi: 10.1148/radiol.2018181494. - DOI - PMC - PubMed
    1. American College of Radiology (2018) Liver Imaging Reporting and Data System version 2018 Manual. Available via: https://www.acr.org/-/media/ACR/Files/Clinical-Resources/LIRADS/LI-RADS-.... Accessed 11th June 2019.