Review
. 2019 Dec;20(12):1627-1637.
doi: 10.3348/kjr.2019.0084.

Doppler US and CT Diagnosis of Nutcracker Syndrome

Affiliations
Review

Doppler US and CT Diagnosis of Nutcracker Syndrome

Seung Hyup Kim. Korean J Radiol. 2019 Dec.

Abstract

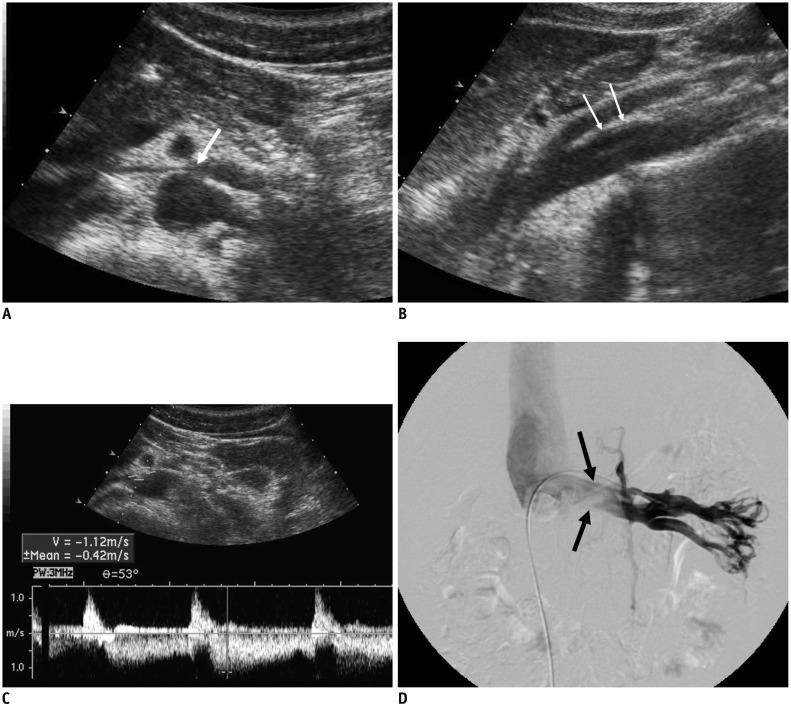
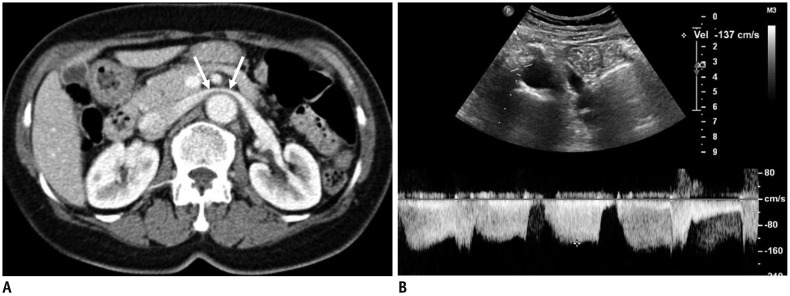
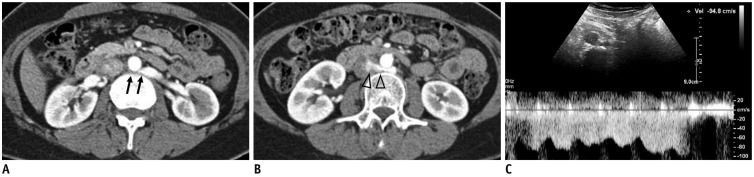
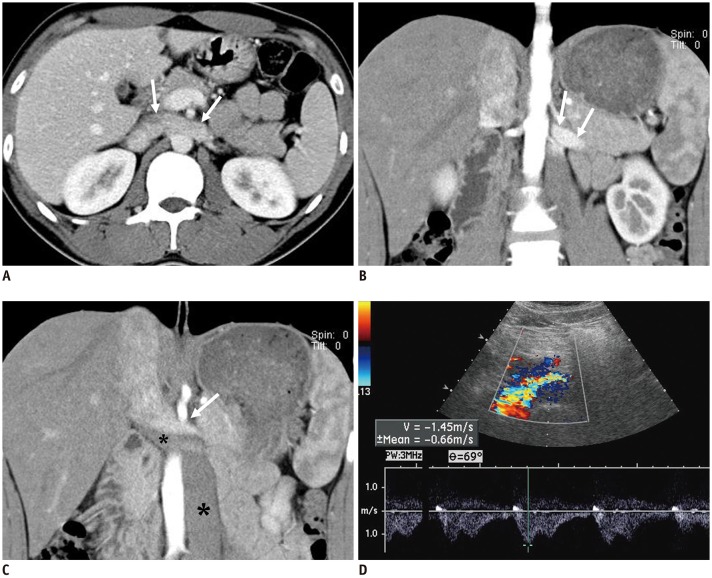
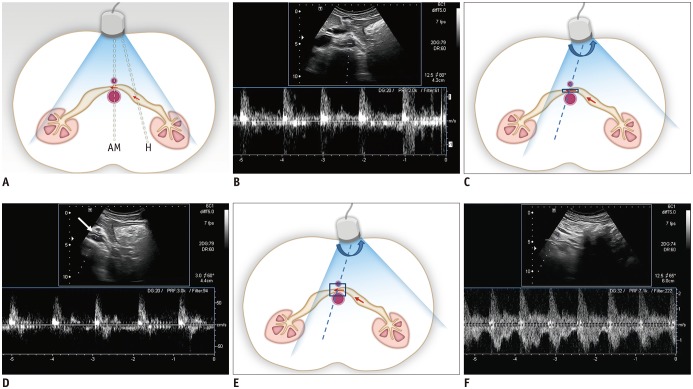
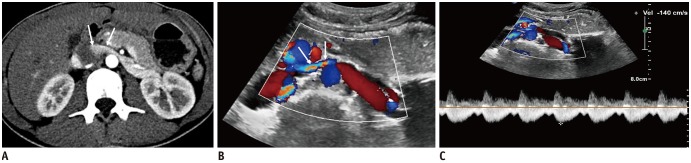
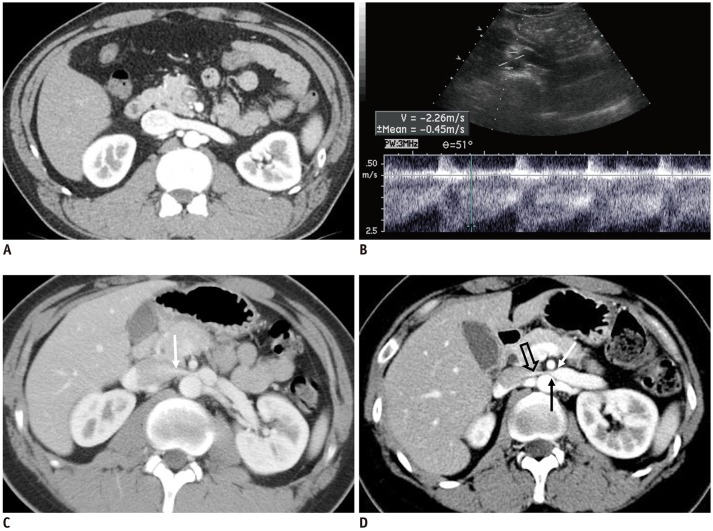
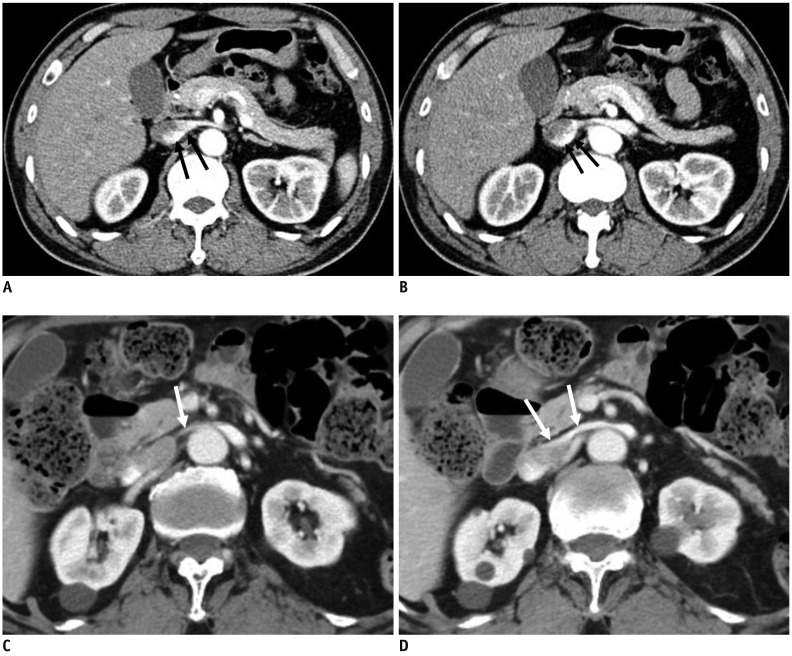
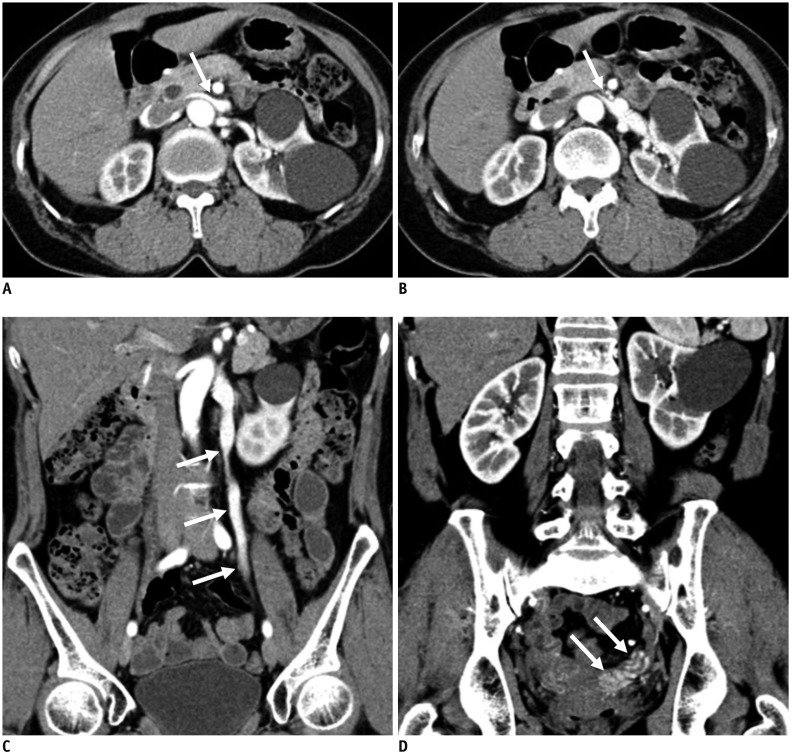
Nutcracker syndrome (NCS) is a syndrome caused by compression of the left renal vein (LRV), between the abdominal aorta and the superior mesenteric artery, resulting in hypertension of the LRV and hematuria. Doppler ultrasonography (US) has been commonly used for the diagnosis of NCS. However, several technical issues, such as Doppler angle and sample volume, need to be considered to obtain satisfactory results. In addition, morphologic changes of the LRV and a jetting phenomenon across the aortomesenteric portion of the LRV on contrast-enhanced computed tomography (CECT) are diagnostic clues of NCS. With proper Doppler US and CECT, NCS can be diagnosed noninvasively.

Keywords: Contrast-enhanced CT; Doppler US; Left renal vein; Nutcracker syndrome; Renal vein hypertension.


Conflict of interest statement

The author has no potential conflicts of interest to disclose.

Figures

Fig. 1
Fig. 1. 18-year-old male patient with NCS.
A. Transverse US of LRV shows compression of LRV at AM portion (arrow). B. Sagittal US of aorta and SMA shows slit-like LRV (arrows), compressed between two vessels. C. Spectral Doppler US of LRV at AM portion shows clear venous flow spectrum, with PV of 112 cm/s. D. Left renal venogram shows compression of LRV at AM portion (arrows). Pressure gradient measured across AM portion of LRV was 4 mm Hg. AM = aortomesenteric, LRV = left renal vein, NCS = nutcracker syndrome, PV = peak velocity, SMA = superior mesenteric artery, US = ultrasonography
Fig. 2
Fig. 2. 72-year-old female patient with NCS.
A. CECT scan shows LRV (arrows) stretched over aorta, without any compression between aorta and SMA. B. Spectral Doppler US of LRV measured at AM portion shows PV of 137 cm/s. CECT = contrast-enhanced CT
Fig. 3
Fig. 3. 49-year-old female patient with posterior NCS.
CECT images in early cortical phase show retroarotic LRV (arrows) (A) compression between abdominal aorta and vertebra. Jetting phenomenon of contrast-opacified venous flow (arrowheads) (B) into IVC can be seen. C. Spectral Doppler US of retroaortic LRV shows high PV of 94.8 cm/s. IVC = inferior vena cava
Fig. 4
Fig. 4. NCS in 20-year-old male patient with left-sided IVC.
A. CECT image shows well-preserved lumen in LRV (arrows), without any compression between aorta and SMA. B, C. Coronal CECT images show left-sided IVC crossing midline and continuous with right-sided suprarenal IVC. Note contrast-opacified venous flow from LRV (arrows), which is compressed by non-opacified venous flow from lower part of body thought left-sided IVC (asterisks). D. Spectral Doppler US performed at midline-crossing of vessel reveals high PV of 145 cm/s. In this patient, LRV is not compressed anatomically, but venous flow from left kidney is hemodynamically impeded by dominant venous flow from lower extremity through left-sided IVC.
Fig. 5
Fig. 5. Schematic drawing of Doppler US of LRV and spectral Doppler US images of LRV.
A. With usual position of US transducer in transverse plane, Doppler angle is optimal to obtain clear spectrum for hilar portion of LRV (H), while angle for AM portion of LRV is around 90°. Arrows indicate direction of blood flow and dotted lines indicate direction of ultrasound beam. B. Spectral Doppler US image of LRV obtained at AM portion shows noisy spectrum from aorta. Therefore, it is almost impossible to measure flow velocity in LRV. C. With slight shift of transducer to left and subtle counterclockwise rotation (curved arrow) until AM portion of LRV is located in left corner of US image, Doppler angle for AM portion of LRV can be adjusted. Arrows indicate direction of blood flow and dotted line indicates direction of ultrasound beam. D. Even with adjustment of Doppler angle, Doppler spectrum from LRV is still not clear, because LRV is not properly located due to small sample volume (arrow). E. In addition to adjustment of Doppler angle, increasing sample volume may help LRV be continuously included within sample volume between pulsating aorta and SMA. Arrows indicate direction of blood flow and dotted line indicates direction of ultrasound beam. F. Doppler spectrum from LRV now becomes optimal, with PV of approximately 150 cm/s.
Fig. 6
Fig. 6. 17-year-old woman with NCS.
A. CECT scan shows compression of LRV between aorta and SMA. Note contrast-opacified venous flow along anterior non-dependent portion of IVC (arrows). B. Color Doppler US of LRV shows bright color flow signal (arrows) at AM portion of LRV due to aliasing artifacts caused by high flow velocity. C. Spectral Doppler US at AM portion of LRV shows PV of 140 cm/s.
Fig. 7
Fig. 7. CECT of kidney in early cortical phase.
A. 45-year-old male without hematuria. CECT shows normal LRV without compression at AM portion and homogeneously opacified LRV and IVC. B, C. 17-year-old male with NCS. B. Doppler US of LRV at AM portion shows high PV (226 cm/s) of LRV. C. CECT in early cortical phase shows jetting of contrast-opacified venous flow (arrow) into IVC across AM portion of LRV. D. 28-year-old female with NCS. CECT shows severely compressed LRV at AM portion, with beak sign (arrows). Note jetting (open arrow) of contrast-opacified venous flow into IVC across AM portion of LRV.
Fig. 8
Fig. 8. Preferential flow of contrast-opacified venous flow on CECT.
A, B. 48-year-old male without hematuria. CECT images in early cortical phase show contrast-opacified venous flow into IVC along dependent posterior aspect of LRV and IVC (arrows). C, D. 82-year-old male with microscopic hematuria. CECT images in early cortical phase show contrast-opacified venous flow into IVC along non-dependent anterior aspect of LRV and IVC (arrows). PV of LRV at AM portion measured by Doppler US was 133 cm/s (not shown).
Fig. 9
Fig. 9. 59-year-old female with concurrent NCS and pelvic congestion syndrome.
Patient complained of persistent microscopic hematuria and chronic pelvic pain. A, B. CECT images show compression of LRV at AM portion (arrows). C, D. CECT images in coronal plane show regurgitation of contrast-opacified LRV flow into left gonadal vein and pelvic veins (arrows).

References

    1. El-Sadr AR, Mina E. Anatomical and surgical aspects in the operative management of varicocele. Urol Cutaneous Rev. 1950;54:257–262. - PubMed
    1. Chait A, Matasar KW, Fabian CE, Mellins HZ. Vascular impressions on the ureters. Am J Roentgenol Radium Ther Nucl Med. 1971;111:729–749. - PubMed
    1. de Schepper A. [“Nutcracker” phenomenon of the renal vein and venous pathology of the left kidney] J Belge Radiol. 1972;55:507–511. - PubMed
    1. Welsch T, Büchler MW, Kienle P. Recalling superior mesenteric artery syndrome. Dig Surg. 2007;24:149–156. - PubMed
    1. Ananthan K, Onida S, Davies AH. Nutcracker syndrome: an update on current diagnostic criteria and management guidelines. Eur J Vasc Endovasc Surg. 2017;53:886–894. - PubMed

MeSH terms