

Use of Oppositely Polarized External Magnets To Improve the Accumulation and Penetration of Magnetic Nanocarriers into Solid Tumors
- PMID: 31854966
- PMCID: PMC7002255
- DOI: 10.1021/acsnano.9b05660
Use of Oppositely Polarized External Magnets To Improve the Accumulation and Penetration of Magnetic Nanocarriers into Solid Tumors
Abstract
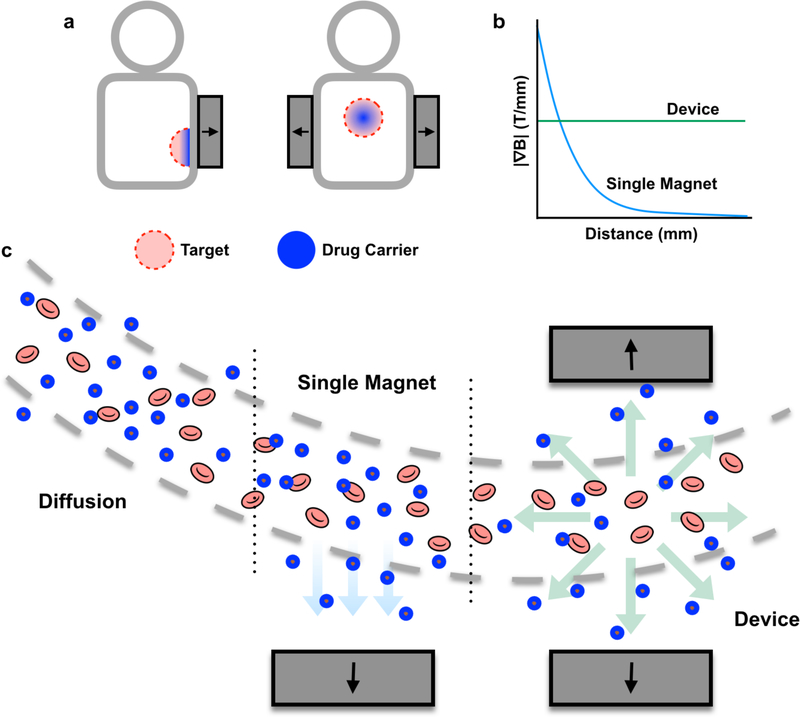
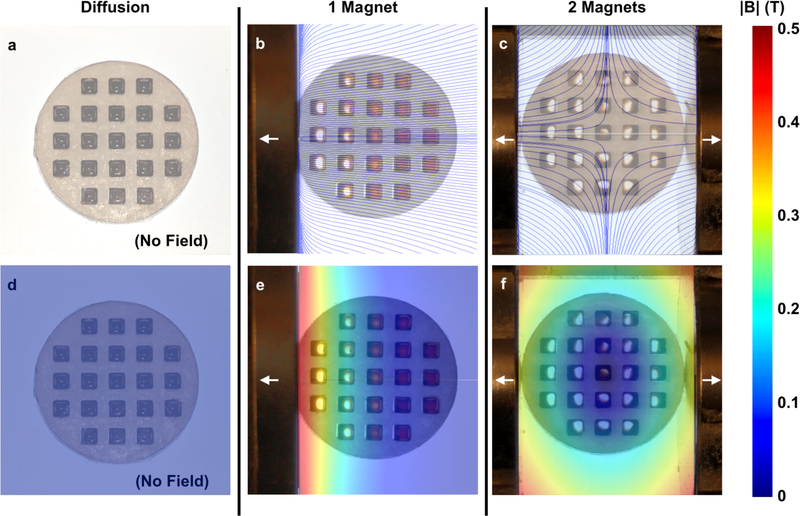
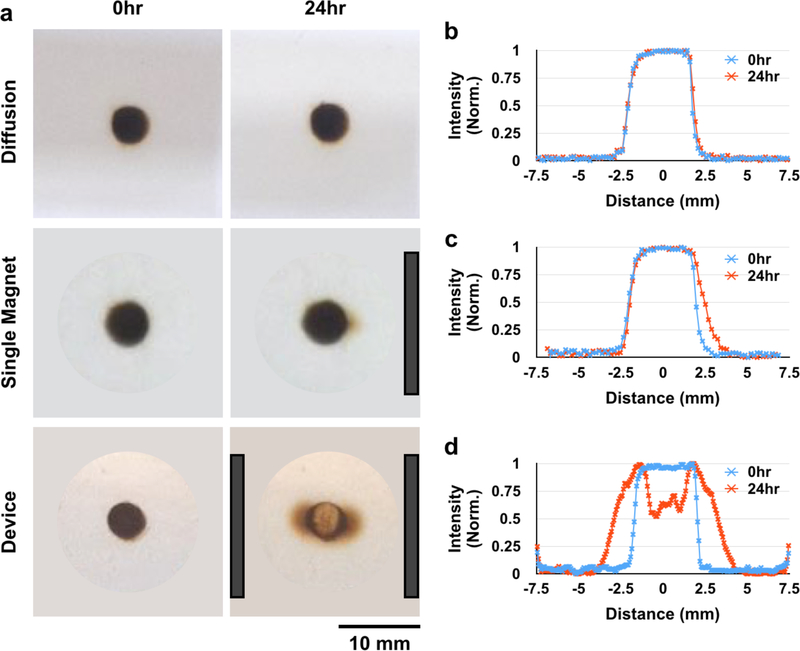
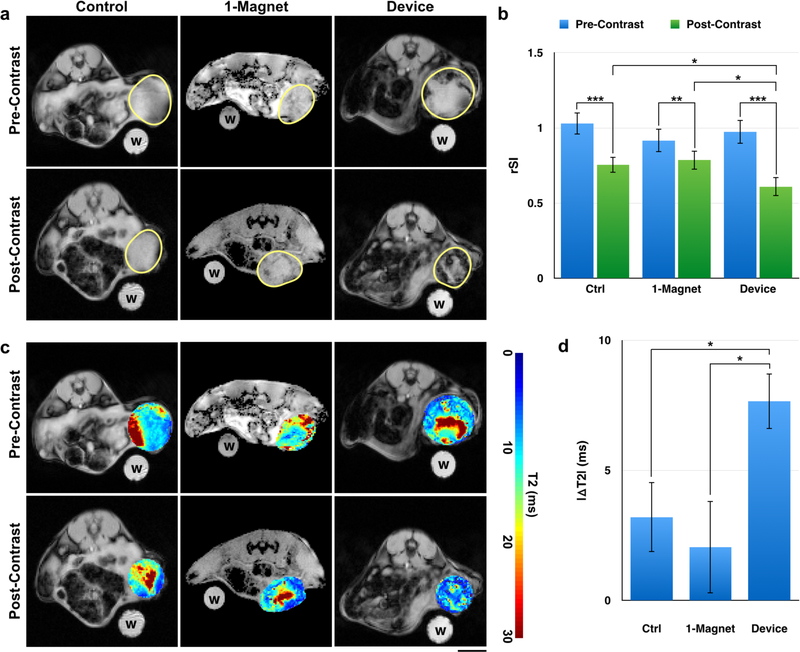
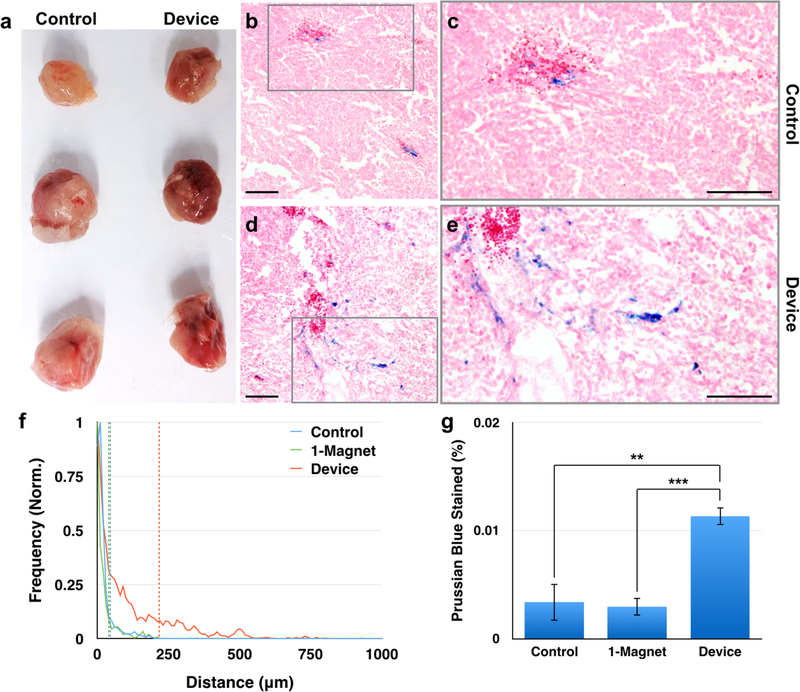
Drug delivery to solid tumors is hindered by hydrostatic and physical barriers that limit the penetration of nanocarriers into tumor tissue. When exploiting the enhanced permeability and retention (EPR) effect for passive targeting of nanocarriers, the increased interstitial fluid pressure and dense extracellular matrix in tumors limits the distribution of the nanocarriers to perivascular regions. Previous strategies have shown that magnetophoresis enhances accumulation and penetration of nanoparticles into solid tumors. However, because magnetic fields fall off rapidly with distance from the magnet, these methods have been limited to use in superficial tumors. To overcome this problem, we have developed a system comprising two oppositely polarized magnets that enables the penetration of magnetic nanocarriers into more deeply seeded tumors. Using this method, we demonstrate a 5-fold increase in the penetration and a 3-fold increase in the accumulation of magnetic nanoparticles within solid tumors compared to EPR.
Keywords: magnetic; magnetophoresis; nanoparticles; penetration; tumor.
Figures
Similar articles
-
Sequential Intra-Intercellular Delivery of Nanomedicine for Deep Drug-Resistant Solid Tumor Penetration.ACS Appl Mater Interfaces. 2020 Feb 26;12(8):8978-8988. doi: 10.1021/acsami.9b20062. Epub 2020 Feb 17. ACS Appl Mater Interfaces. 2020. PMID: 32020804
-
Engineered strategies to enhance tumor penetration of drug-loaded nanoparticles.J Control Release. 2022 Jan;341:227-246. doi: 10.1016/j.jconrel.2021.11.024. Epub 2021 Nov 22. J Control Release. 2022. PMID: 34822909 Review.
-
Enhanced Accumulation and Penetration of Magnetic Nanoclusters in Tumors Using an 8-Magnet Halbach Array Leads to Improved Cancer Treatment.ACS Nano. 2025 Jan 14;19(1):1794-1808. doi: 10.1021/acsnano.4c16600. Epub 2025 Jan 3. ACS Nano. 2025. PMID: 39749910
-
Near-infrared light and magnetic field dual-responsive porous silicon-based nanocarriers to overcome multidrug resistance in breast cancer cells with enhanced efficiency.J Mater Chem B. 2020 Jan 22;8(3):546-557. doi: 10.1039/c9tb02340b. J Mater Chem B. 2020. PMID: 31854435
-
Tale of Two Magnets: An Advanced Magnetic Targeting System.ACS Nano. 2020 Jan 28;14(1):7-11. doi: 10.1021/acsnano.9b06842. Epub 2019 Dec 23. ACS Nano. 2020. PMID: 31869210 Review.
Cited by
-
Surface-engineered smart nanocarrier-based inhalation formulations for targeted lung cancer chemotherapy: a review of current practices.Drug Deliv. 2021 Dec;28(1):1995-2010. doi: 10.1080/10717544.2021.1981492. Drug Deliv. 2021. PMID: 34569401 Free PMC article. Review.
-
Electromagnetic Field-Programmed Magnetic Vortex Nanodelivery System for Efficacious Cancer Therapy.Adv Sci (Weinh). 2021 Sep;8(18):e2100950. doi: 10.1002/advs.202100950. Epub 2021 Jul 18. Adv Sci (Weinh). 2021. PMID: 34279055 Free PMC article.
-
Advances in engineering nanoparticles for magnetic particle imaging (MPI).Sci Adv. 2025 Jan 10;11(2):eado7356. doi: 10.1126/sciadv.ado7356. Epub 2025 Jan 8. Sci Adv. 2025. PMID: 39772674 Free PMC article. Review.
-
Using magnetic particle imaging systems to localize and guide magnetic hyperthermia treatment: tracers, hardware, and future medical applications.Theranostics. 2020 Feb 10;10(7):2965-2981. doi: 10.7150/thno.40858. eCollection 2020. Theranostics. 2020. PMID: 32194849 Free PMC article. Review.
-
Field-Induced Agglomerations of Polyethylene-Glycol-Functionalized Nanoclusters: Rheological Behaviour and Optical Microscopy.Pharmaceutics. 2023 Nov 10;15(11):2612. doi: 10.3390/pharmaceutics15112612. Pharmaceutics. 2023. PMID: 38004590 Free PMC article.
References
-
- Cooper GM The Development and Causes of Cancer In The Cell: A Molecular Approach; Sinauer Associates: Sunderland, MA, 2000.
-
- Danhier F; Feron O; Préat V To Exploit the Tumor Microenvironment: Passive and Active Tumor Targeting of Nanocarriers for Anti-Cancer Drug Delivery. J. Controlled Release 2010, 148, 135–146. - PubMed
-
- Perrault SD; Walkey C; Jennings T; Fischer HC; Chan WCW Mediating Tumor Targeting Efficiency of Nanoparticles Through Design. Nano Lett. 2009, 9, 1909–1915. - PubMed
Publication types
MeSH terms
Substances
Grants and funding
LinkOut - more resources
Full Text Sources
Medical
