Review
. 2020 Jan:159:106255.
doi: 10.1016/j.eplepsyres.2019.106255. Epub 2019 Dec 9.

Emerging roles of network analysis for epilepsy

Affiliations
Review

Emerging roles of network analysis for epilepsy

William Stacey et al. Epilepsy Res. 2020 Jan.

Abstract

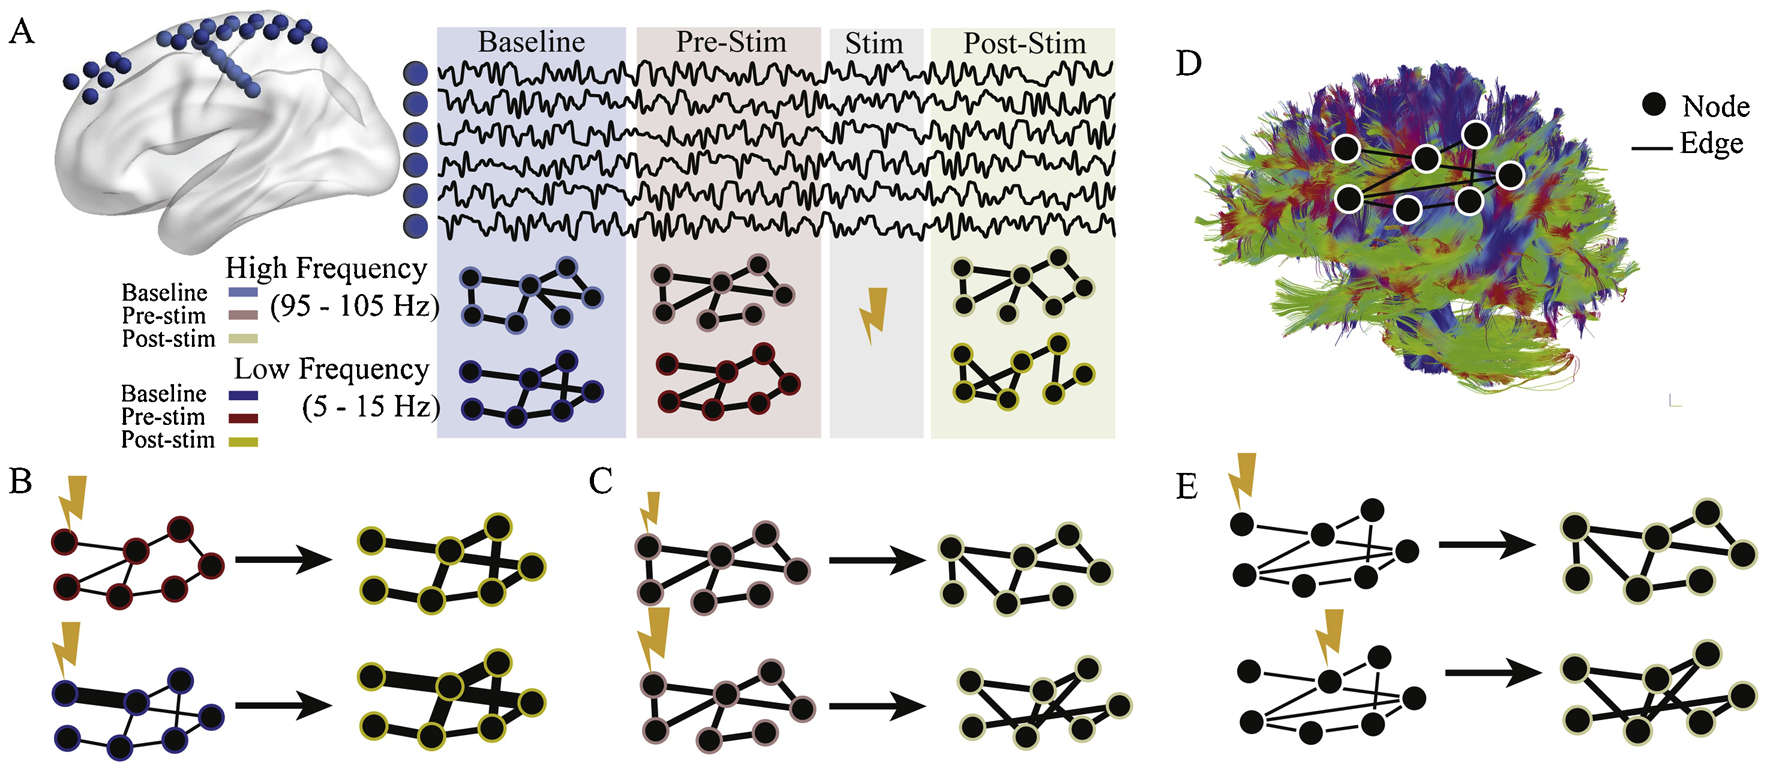
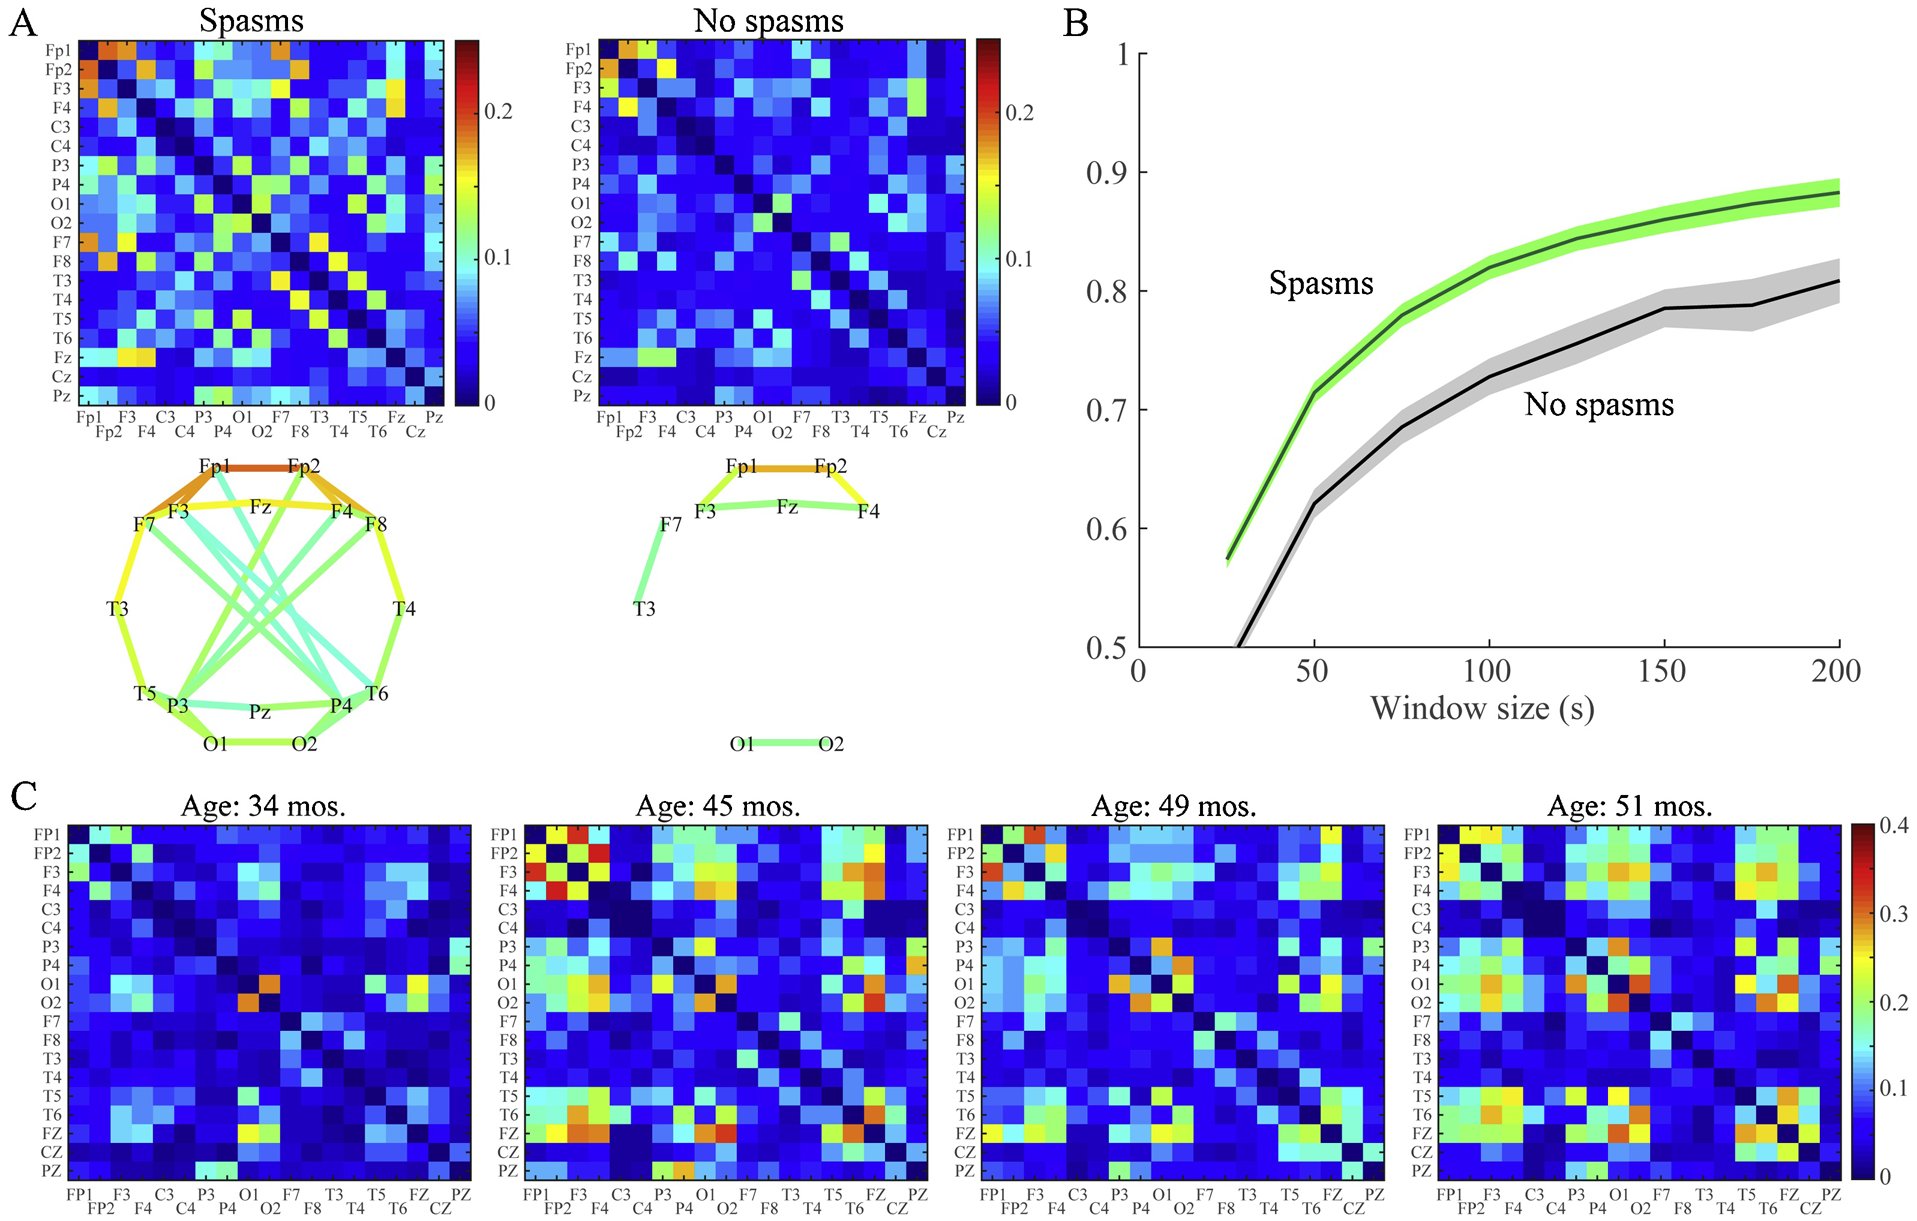
In recent years there has been increasing interest in applying network science tools to EEG data. At the 2018 American Epilepsy Society conference in New Orleans, LA, the yearly session of the Engineering and Neurostimulation Special Interest Group focused on emerging, translational technologies to analyze seizure networks. Each speaker demonstrated practical examples of how network tools can be utilized in clinical care and provide additional data to help care for patients with intractable epilepsy. The groups presented advances using tools from functional connectivity, control theory, and graph theory to analyze human EEG data. These tools have great potential to augment clinical interpretation of EEG signals.

Keywords: Control theory; EEG; Functional connectivity; Graph theory; Infantile spasms; Network analysis.


Figures

Figure 1:
Figure 1:. A candidate functional network analysis pipeline, with five steps.
While the arrows indicate a linear progression between steps, the interactions between steps are more complicated.
Figure 2:
Figure 2:. Network model set-up
A) Definition of model states. B) Network model for each 500 msec window of EEG. C) Flowchart of the computational tool. Structural (e.g. DTI) and functional (e.g. SEEG) information are inputs to the algorithm, which produces an augmented denser coverage.
Figure 3:
Figure 3:. Predator-prey model
(Top) Population of lions and gazelles over time. (Bottom) Dynamical 2-node network model describing populations over time, assigning a differential equation for each population.
Figure 4:
Figure 4:. Estimating signals of missing electrodes
A) ECoG implantation for patient. B) 10 second snapshot of actual (red) versus estimated (blue) signals of 4 missing contacts from one depth electrode. Two contacts were clinically labeled as early onset zone because of spikes highlighted in zoom-in panel shown. Note that no spikes were visible in all other signals, demonstrating that with knowledge of network model, the observer is able to very accurately reconstruct missing contact signals, including important spike events.
Figure 5:
Figure 5:. Graph theory to estimate different responses to electrical stimulation
(A) Methods and experimental design. 94 individuals with implanted intracranial EEG electrodes (blue spheres) voluntarily participated in a stimulation regimen. Each subject had baseline (blue) recording with no stimulation, followed by several stimulation trials, with pre- (red) and post-stimulation (yellow) epochs. For each of these epochs, functional networks were constructed by calculating multi-taper coherence between all electrodes in one of four frequency bands (5–15 Hz, 15–25 Hz, 30–40Hz, or 95–105 Hz). Only two are shown for simplicity. (B, top) In low frequencies (5–15 Hz), the node strengths, or sum of connection weights, increase between pre- and post-stimulation epochs. (B, bottom) Nodes with high baseline coherence to the stimulated region have larger increases in strength. (C) In high frequencies (95–105 Hz), the pattern of edge similarity changes with stimulation. This change is larger for stimulation with higher frequency (bottom). (D) An example of a structural brain network obtained with DWI, where edges are proportional to the density of white matter connections between regions. (E) When stimulating structural nodes that are weakly connected (top), functional connectivity patterns of the high frequency band undergo less reorganization than when stimulating structural nodes that are strongly connected (bottom).
Figure 6:
Figure 6:. Epileptic spasms are associated with strong, stable functional networks.
(A) Average functional connectivity matrices (top row) and network maps (bottom row) for patients with and without spasms. The color represents the connectivity strength, defined as the proportion of 1-second epochs for which the connectivity between two channels was statistically significant. Network maps show all connections with strength > 0.1. (B) Test-retest reliability of the FCN for the spasms group (green) and the non-spasms group (gray) measured via 2D correlation of the connectivity matrices for EEG segments of varying length. The solid lines represent the mean, and shaded areas denote the 95% confidence interval across all subjects in the group. FCNs are reliable when measured using segments of EEG at least 150 seconds long, and the spasms group exhibited higher reliability than controls. (C) A representative example of FCNs from longitudinal EEGs of a patient who had spasms and was diagnosed with Lennox-Gastaut at 45 months old. The strength of the FCN increases with onset of Lennox-Gastaut and varies over time; however, note that the locations of the strongest connections in the network remain stable over the 17 month period. This patient experienced continued seizures, despite multiple medication changes.

References

    1. Adebimpe A, Aarabi A, Bourel-Ponchel E, Mahmoudzadeh M, Wallois F, 2016. EEG Resting State Functional Connectivity Analysis in Children with Benign Epilepsy with Centrotemporal Spikes. Frontiers in neuroscience 10, 143. - PMC - PubMed
    1. Bassett DS, Sporns O, 2017. Network neuroscience. Nature neuroscience 20, 353–364. - PMC - PubMed
    1. Bassett DS, Zurn P, Gold JI, 2018. On the nature and use of models in network neuroscience. Nat Rev Neurosci 19, 566–578. - PMC - PubMed
    1. Bowyer SM, 2016. Coherence a measure of the brain networks: past and present. Neuropsychiatric Electrophysiology 2, 1.
    1. Brazier MA, 1972. Spread of seizure discharges in epilepsy: anatomical and electrophysiological considerations. Exp Neurol 36, 263–272. - PubMed

Publication types