. 2020 Feb 15;80(4):901-911.
doi: 10.1158/0008-5472.CAN-19-1794. Epub 2019 Dec 19.

Cell Adhesiveness Serves as a Biophysical Marker for Metastatic Potential

Affiliations

Cell Adhesiveness Serves as a Biophysical Marker for Metastatic Potential

Pranjali Beri et al. Cancer Res. .

Abstract

Tumors are heterogeneous and composed of cells with different dissemination abilities. Despite significant effort, there is no universal biological marker that serves as a metric for metastatic potential of solid tumors. Common to disseminating cells from such tumors, however, is the need to modulate their adhesion as they detach from the tumor and migrate through stroma to intravasate. Adhesion strength is heterogeneous even among cancer cells within a given population, and using a parallel plate flow chamber, we separated and sorted these populations into weakly and strongly adherent groups; when cultured under stromal conditions, this adhesion phenotype was stable over multiple days, sorting cycles, and common across all epithelial tumor lines investigated. Weakly adherent cells displayed increased migration in both two-dimensional and three-dimensional migration assays; this was maintained for several days in culture. Subpopulations did not show differences in expression of proteins involved in the focal adhesion complex but did exhibit intrinsic focal adhesion assembly as well as contractile differences that resulted from differential expression of genes involved in microtubules, cytoskeleton linkages, and motor activity. In human breast tumors, expression of genes associated with the weakly adherent population resulted in worse progression-free and disease-free intervals. These data suggest that adhesion strength could potentially serve as a stable marker for migration and metastatic potential within a given tumor population and that the fraction of weakly adherent cells present within a tumor could act as a physical marker for metastatic potential. SIGNIFICANCE: Cancer cells exhibit heterogeneity in adhesivity, which can be used to predict metastatic potential.


Conflict of interest statement

Disclosure of Potential Conflicts of Interest

No potential conflicts of interest were disclosed.

Figures

Figure 1:
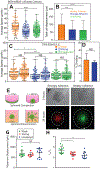
Figure 1:. Low Cation PPFC Accurately and Precisely Sorts Cancer Cell Populations that are Stable Long-term.
(A) MDA-MB231 populations were sorted at day 0, remixed, and then resorted at day 2. Differences between weakly and strongly adherent populations were assessed by two-tailed unpaired t-test (n=3). (B) Adherent cells post-sort were cultured in high cations for 3, 6, 11, and 14 days and resorted. Cells that detached were cultured in high cations or low cations mirroring stroma prior to re-sorting. Differences between weakly and strongly adherent populations as a function of culture time and condition were assessed by two-way ANOVA with Tukey test for multiple comparisons (n=3). For time and condition, ANOVA showed ***p<0.001 and ****p<0.0001, respectively as indicated at the corner of the plot. Individual comparisons to their counterpart cation conditions are indicated in the plot with p<0.1, and *p<0.05. (C) Images of cells from the flow-through (detached) and remaining on the plate (adherent) after exposure to shear along with quantification of the percentage of cells that detached relative to plated cells from each line. n=3. ***p<0.001 for two-tailed unpaired t-test between lines. (D) Plot showing the fraction of detached cells from MDA-MB231, MCF7, and MCF10A and their H-Ras transformed counterparts MCF10AT after exposure to 250 dynes/cm2 of shear stress.
Figure 2:
Figure 2:. Sorted Populations of Single cells and Spheroids Exhibit and Sustain Different Migration Patterns.
(A) Average speed and (B) total displacement is plotted for MDA-MB231 cells sorted by the indicated shear stress and allowed to migrate on collagen gels for 24 hours. Percentages in panel A reflect the portion of each population that detaches or remains adherent at a given stress. n=3 biological replicates for the number of cells per condition inset in the bars in panel B. (C) Average speed was measured after initial isolation and after 2 days. n=3 biological replicates. (D) Plot showing the percentage of dividing cells on a collagen gel over 24 hours for cells selected by the indicated shear stress. n=3 biological replicates. (E) Schematic of tumor spheroid formation (top) and subsequent dissemination (bottom) in a collagen gel. (F) Brightfield images at the time of spheroid embedding in a collagen gel and fluorescent image 24 hours later. Dashed line indicates the average radius of disseminating cells. Plots of (G) maximum and (H) normalized average outward radial migration of cells selected by indicated shear (see Supplemental Figure 5 for radius measurements). One-way ANOVA with Tukey test for multiple comparisons was used to indicate significance where *p<0.05, **p<0.01, ***p<0.001, ***p<0.0001, and N.S. = not significant.
Figure 3:
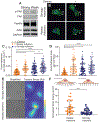
Figure 3:. Adherent Phenotypes within a Cancer Line Result from Intrinsic Adhesion Stability and Contractility Differences.
(A) Comparison of the expression of common focal adhesion proteins in strongly adherent (SA) and weakly adherent (WA) cells. (B) Representative images of focal adhesions in SA and WA cells when subjected to with or without cation conditions. (C) Focal adhesion density and (D) total area per cell area is plotted for the indicated sorting and cation conditions. n=3 biological replicates and >50 cells/condition. One-way ANOVA, with Tukey’s multiple comparison test was performed for the indicated comparisons with **p<0.01, ***p<0.001, and ****p<0.0001. (E) Brightfield and traction stress plots for cells from the indicated shear conditions. Scale bar is 10 microns. (F) Plot of normalized strain energy for WA and SA cells. n=3 biological replicates and >30 cells/condition. A two-tailed unpaired t-test between lines indicated **p<0.01, ***p<0.001, and ****p<0.0001.
Figure 4:
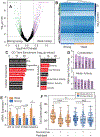
Figure 4:. RNA-seq Identifies Intrinsic Patterns that Indicate Structural rather than Expression Changes in Adhesion.
(A) Differences in gene expression between weakly and strongly adherent MDA-MB231 cells. (B) Hierarchical clustering of differentially expressed genes between weakly and strongly adherent cells. Vertical bars indicate clustering of genes that are upregulated in strongly adherent cells and weakly adherent cells. (C) Genes ontology terms that are upregulated in the weakly adherent subpopulation. Cytoskeletal and microtubule gene ontology terms, as well as proteins that bind to these components, were significantly upregulated in weakly adherent cells. (D) Expressions of genes upregulated in Cytoskeleton and Motor Activity, normalized to strongly adherent subpopulation. (E) Validation of RNA seq gene expression differences via qPCR for select genes. *p<0.05 and **p<0.01 for two-tailed unpaired t-test between weakly and strongly adherent cells. (F) Average speed of weakly and strongly adherent cells when treated with microtubule-targeting drugs. At identical concentrations of nocodazole (0.2 ug/mL) and paclitaxel (0.5 ug/mL), weakly adherent cells displayed a significant decrease in migration speed, while the strongly adherent cells demonstrated no change. One-way ANOVA, with Tukey’s multiple comparison test was performed for the indicated comparisons with **p<0.01, ***p<0.001, and ****p<0.0001.
Figure 5:
Figure 5:. Expression of microtubule-associated genes resembling weakly adherent fraction predicts poor outcome in breast cancer patients.
(A) Progression-free interval and (B) disease-free interval of TNBC patients with Stage I-III tumors. Patients with gene expression that resembled strongly adherent and weakly adherent cells were compared. Genes were restricted to those associated with highlighted GO terms in Figure 4C, resulting in a cohort of 100 genes.

References

    1. Steeg PS, Targeting metastasis. Nature Reviews Cancer 16, 201–218 (2016). - PMC - PubMed
    1. L. SR, D. MK, Ahmedin J, Cancer statistics, 2018. CA: A Cancer Journal for Clinicians 68, 7–30 (2018). - PubMed
    1. Quintana E et al., Efficient tumour formation by single human melanoma cells. Nature 456, 593 (2008). - PMC - PubMed
    1. Polyak K, Heterogeneity in breast cancer. The Journal of Clinical Investigation 121, 3786–3788 (2011). - PMC - PubMed
    1. Sun X.-x., Yu Q, Intra-tumor heterogeneity of cancer cells and its implications for cancer treatment. Acta Pharmacologica Sinica 36, 1219 (2015). - PMC - PubMed

Publication types

MeSH terms