

Lateral Decubitus Digital Subtraction Myelography: Tips, Tricks, and Pitfalls
- PMID: 31857327
- PMCID: PMC6975319
- DOI: 10.3174/ajnr.A6368
Lateral Decubitus Digital Subtraction Myelography: Tips, Tricks, and Pitfalls
Abstract
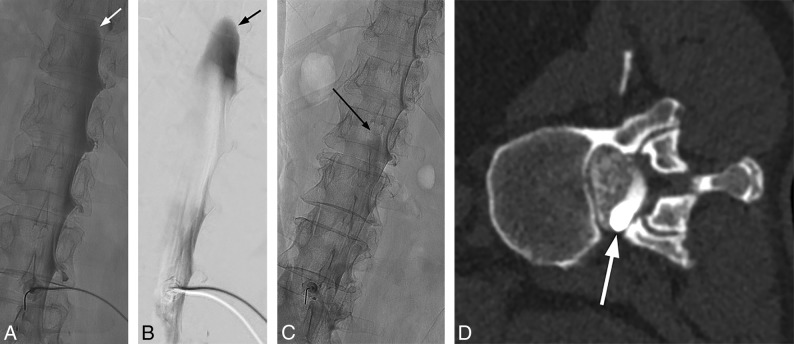
Digital subtraction myelography is a valuable diagnostic technique to detect the exact location of CSF leaks in the spine to facilitate appropriate diagnosis and treatment of spontaneous spinal CSF leaks. Digital subtraction myelography is an excellent diagnostic tool for assessment of various types of CSF leaks, and lateral decubitus digital subtraction myelography is increasingly being used to diagnose CSF-venous fistulas. Lateral decubitus digital subtraction myelography differs from typical CT and fluoroscopy-guided myelograms in many ways, including equipment, supplies, and injection and image-acquisition techniques. Operators should be familiar with techniques, common pitfalls, and artifacts to improve diagnostic yield and prevent nondiagnostic examinations.
© 2020 by American Journal of Neuroradiology.
Figures
Similar articles
-
Spinal Cerebrospinal Fluid Leak Localization with Digital Subtraction Myelography: Tips, Tricks, and Pitfalls.Radiol Clin North Am. 2024 Mar;62(2):321-332. doi: 10.1016/j.rcl.2023.10.004. Epub 2023 Nov 11. Radiol Clin North Am. 2024. PMID: 38272624 Review.
-
Safety of Consecutive Bilateral Decubitus Digital Subtraction Myelography in Patients with Spontaneous Intracranial Hypotension and Occult CSF Leak.AJNR Am J Neuroradiol. 2020 Oct;41(10):1953-1957. doi: 10.3174/ajnr.A6765. Epub 2020 Sep 3. AJNR Am J Neuroradiol. 2020. PMID: 32883671 Free PMC article.
-
Utility of Dual-Energy CT to Improve Diagnosis of CSF Leaks on CT Myelography following Lateral Decubitus Digital Subtraction Myelography with Negative Findings.AJNR Am J Neuroradiol. 2022 Oct;43(10):1539-1543. doi: 10.3174/ajnr.A7628. Epub 2022 Sep 8. AJNR Am J Neuroradiol. 2022. PMID: 36574327 Free PMC article.
-
Diagnosis of a Cerebrospinal Fluid-Venous Fistula Associated with a Venous Malformation Using Digital Subtraction and Computed Tomography Myelography.World Neurosurg. 2020 Mar;135:262-266. doi: 10.1016/j.wneu.2019.12.075. Epub 2019 Dec 21. World Neurosurg. 2020. PMID: 31870817
-
CSF-Venous Fistulas: Anatomy and Diagnostic Imaging.AJR Am J Roentgenol. 2021 Dec;217(6):1418-1429. doi: 10.2214/AJR.21.26182. Epub 2021 Jun 30. AJR Am J Roentgenol. 2021. PMID: 34191547 Review.
Cited by
-
Non-invasive biomarkers for spontaneous intracranial hypotension (SIH) through phase-contrast MRI.J Neurol. 2024 Jul;271(7):4336-4347. doi: 10.1007/s00415-024-12365-6. Epub 2024 Apr 21. J Neurol. 2024. PMID: 38643444 Free PMC article.
-
A Novel Endovascular Therapy for CSF Hypotension Secondary to CSF-Venous Fistulas.AJNR Am J Neuroradiol. 2021 May;42(5):882-887. doi: 10.3174/ajnr.A7014. Epub 2021 Feb 4. AJNR Am J Neuroradiol. 2021. PMID: 33541895 Free PMC article.
-
The importance of repeat digital subtraction myelography in the diagnosis of cryptogenic CSF-venous fistula causing spontaneous intracranial hypotension.Interv Neuroradiol. 2021 Oct;27(5):727-732. doi: 10.1177/1591019921991398. Epub 2021 Feb 1. Interv Neuroradiol. 2021. PMID: 33525918 Free PMC article.
-
Safety and Technical Performance of Bilateral Decubitus CT Myelography Using Standard versus Increased Intrathecal Iodinated Contrast Volume.AJNR Am J Neuroradiol. 2025 Feb 3;46(2):401-407. doi: 10.3174/ajnr.A8436. AJNR Am J Neuroradiol. 2025. PMID: 39134376
-
Same-Day Bilateral Decubitus CT Myelography for Detecting CSF-Venous Fistulas in Spontaneous Intracranial Hypotension.AJNR Am J Neuroradiol. 2022 Apr;43(4):645-648. doi: 10.3174/ajnr.A7476. Epub 2022 Mar 24. AJNR Am J Neuroradiol. 2022. PMID: 35332017 Free PMC article.
References
Publication types
MeSH terms
LinkOut - more resources
Full Text Sources