. 2019 Dec 20;366(6472):1531-1536.
doi: 10.1126/science.aav4011. Epub 2019 Dec 19.

VDAC oligomers form mitochondrial pores to release mtDNA fragments and promote lupus-like disease

Affiliations

VDAC oligomers form mitochondrial pores to release mtDNA fragments and promote lupus-like disease

Jeonghan Kim et al. Science. .

Abstract

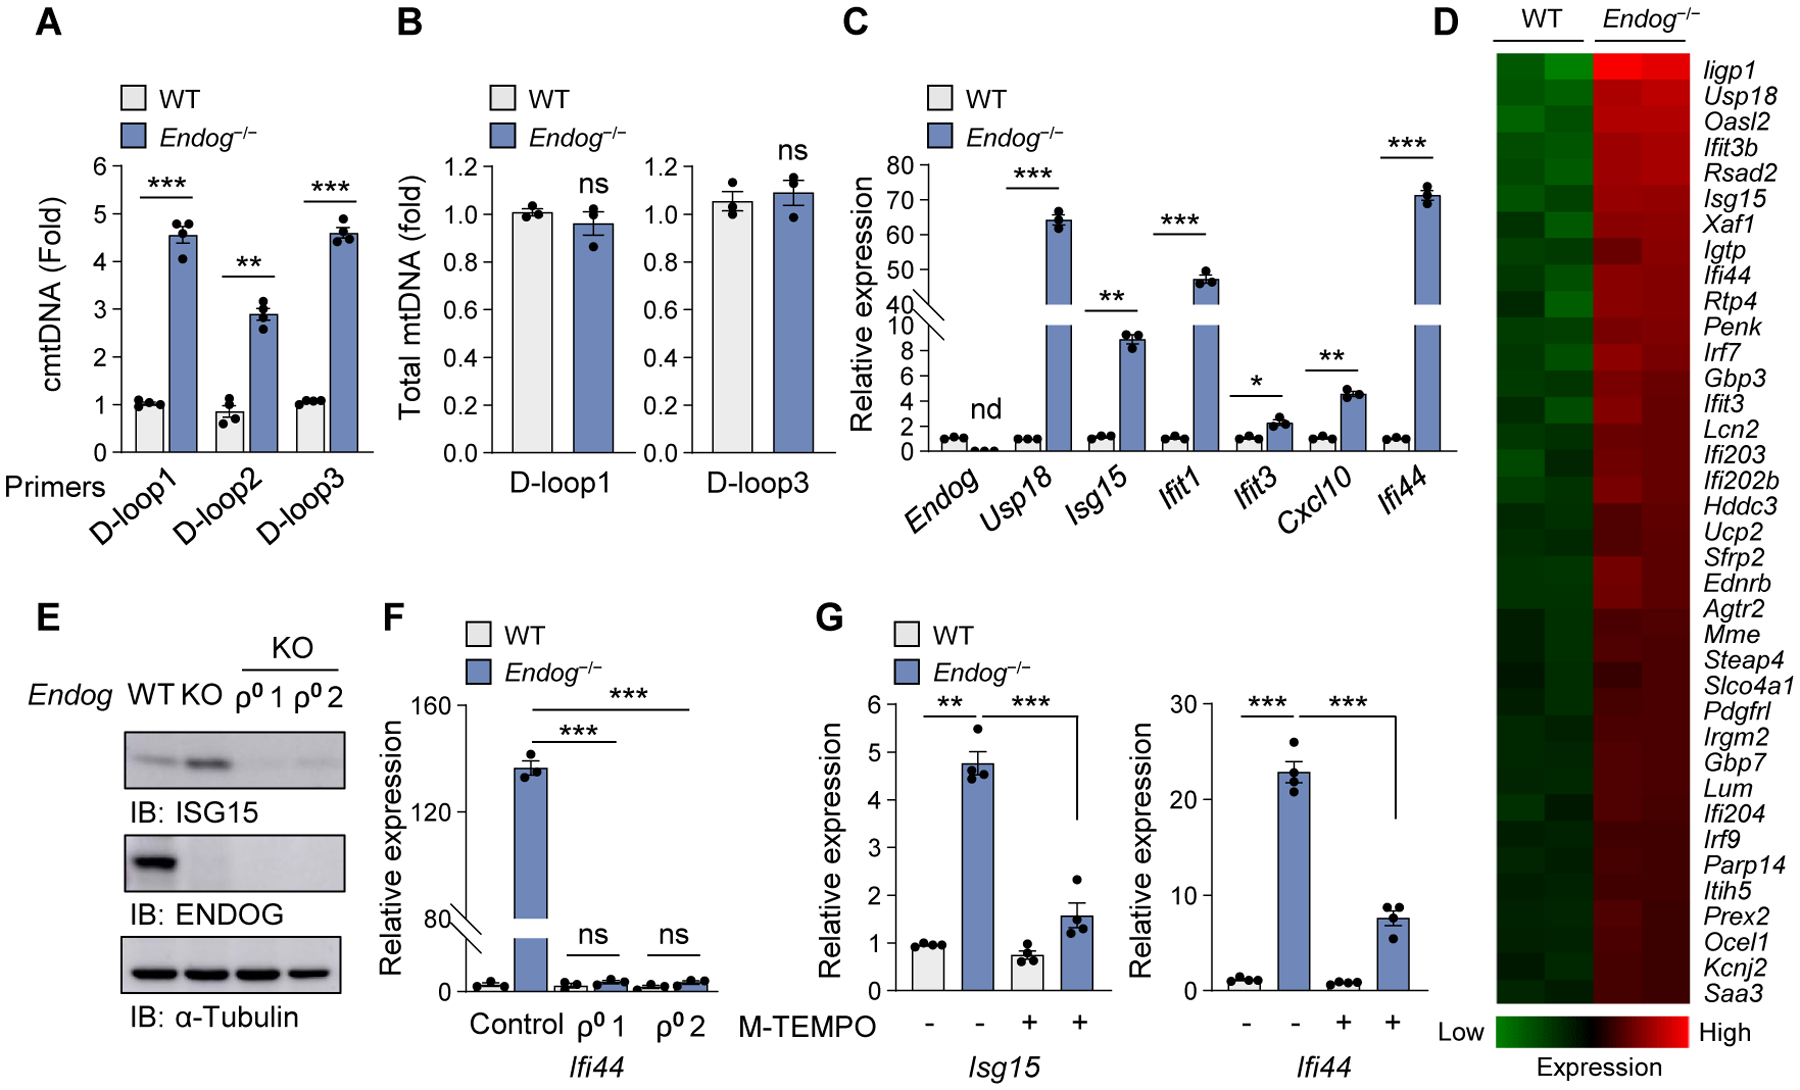
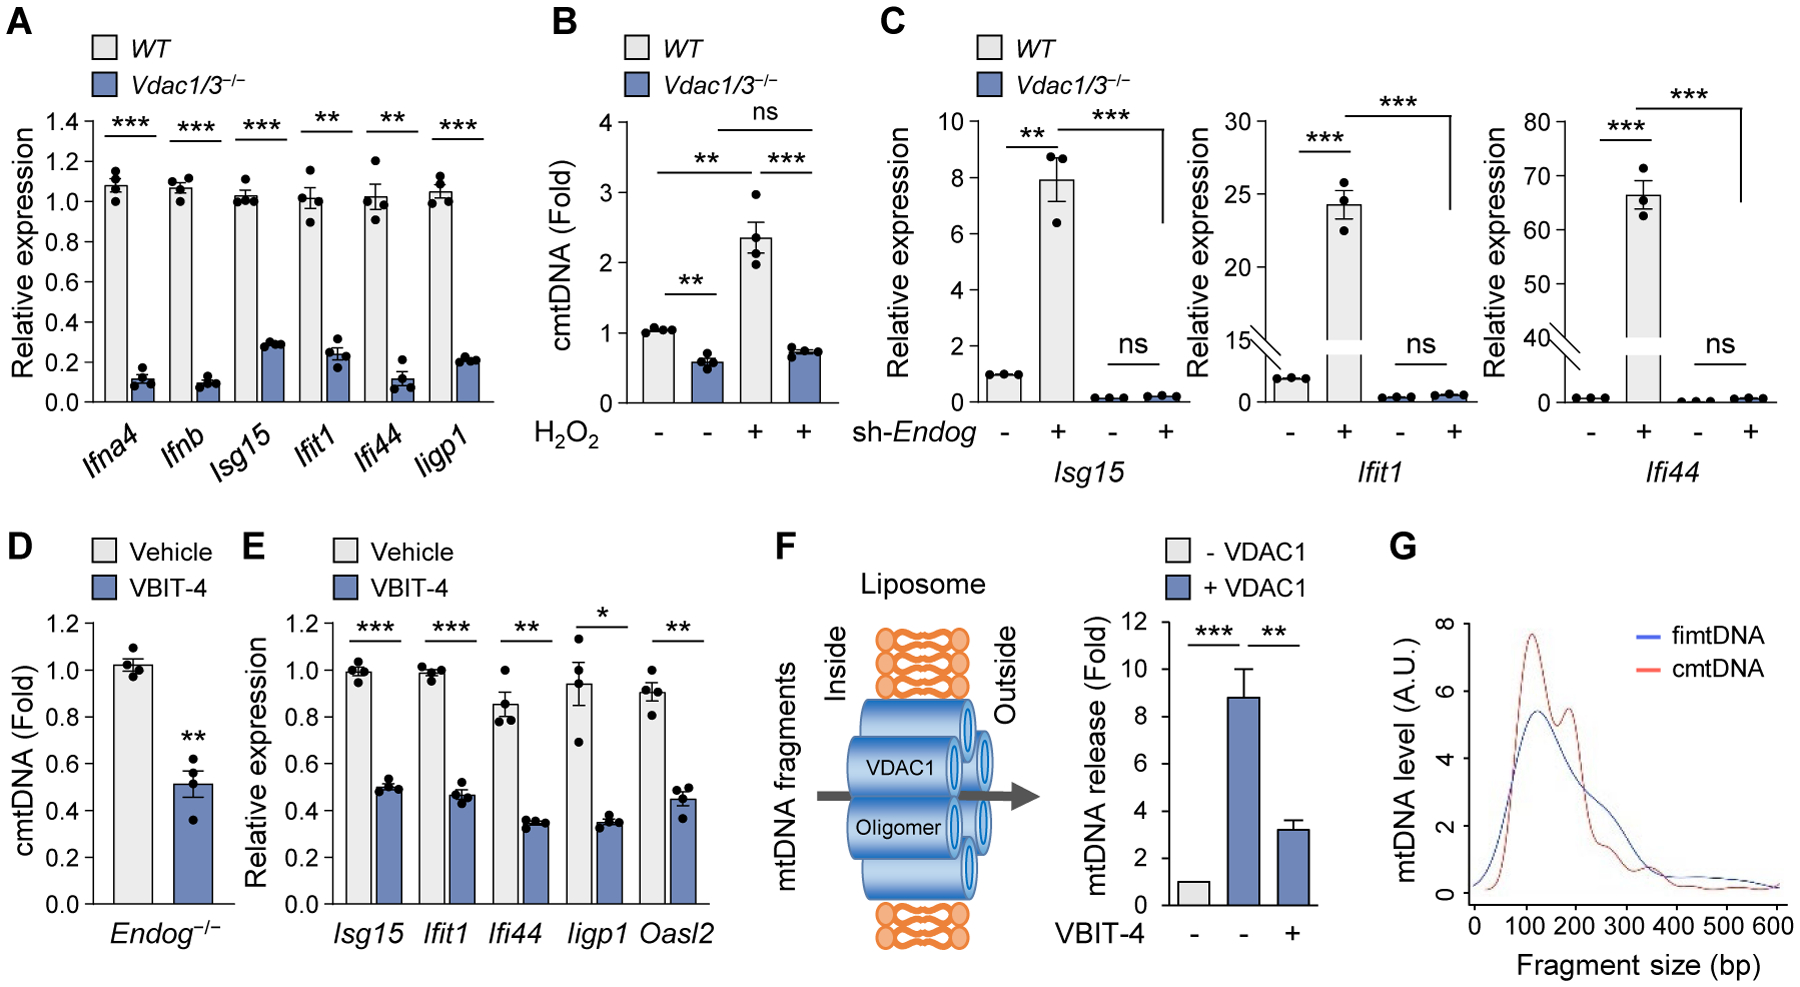
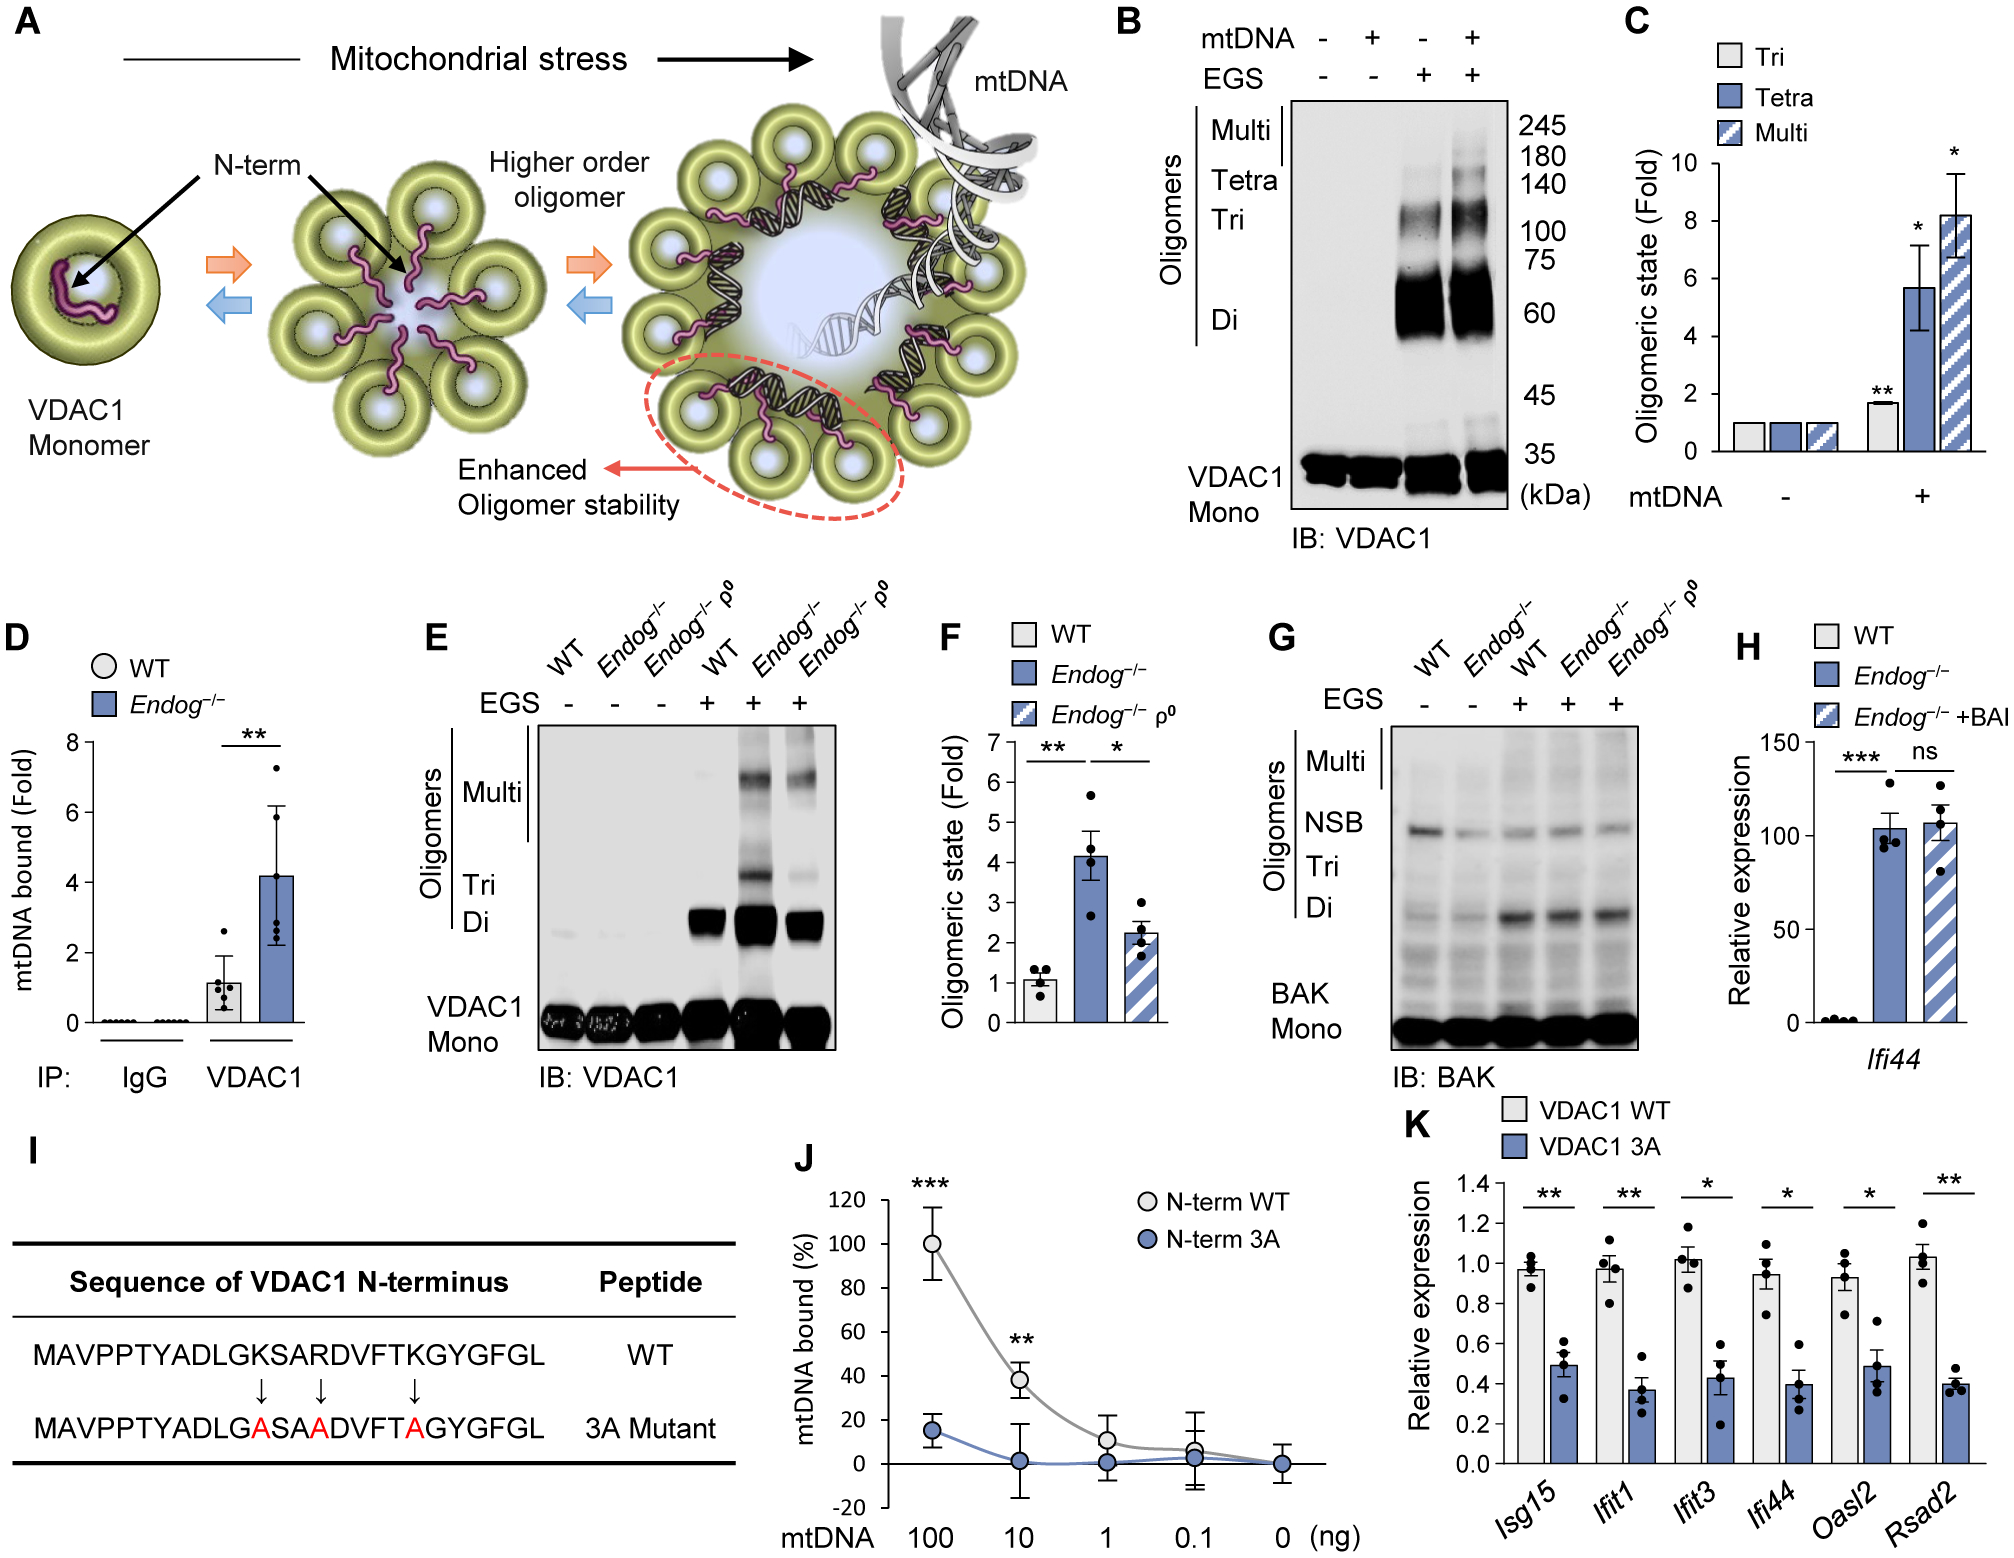
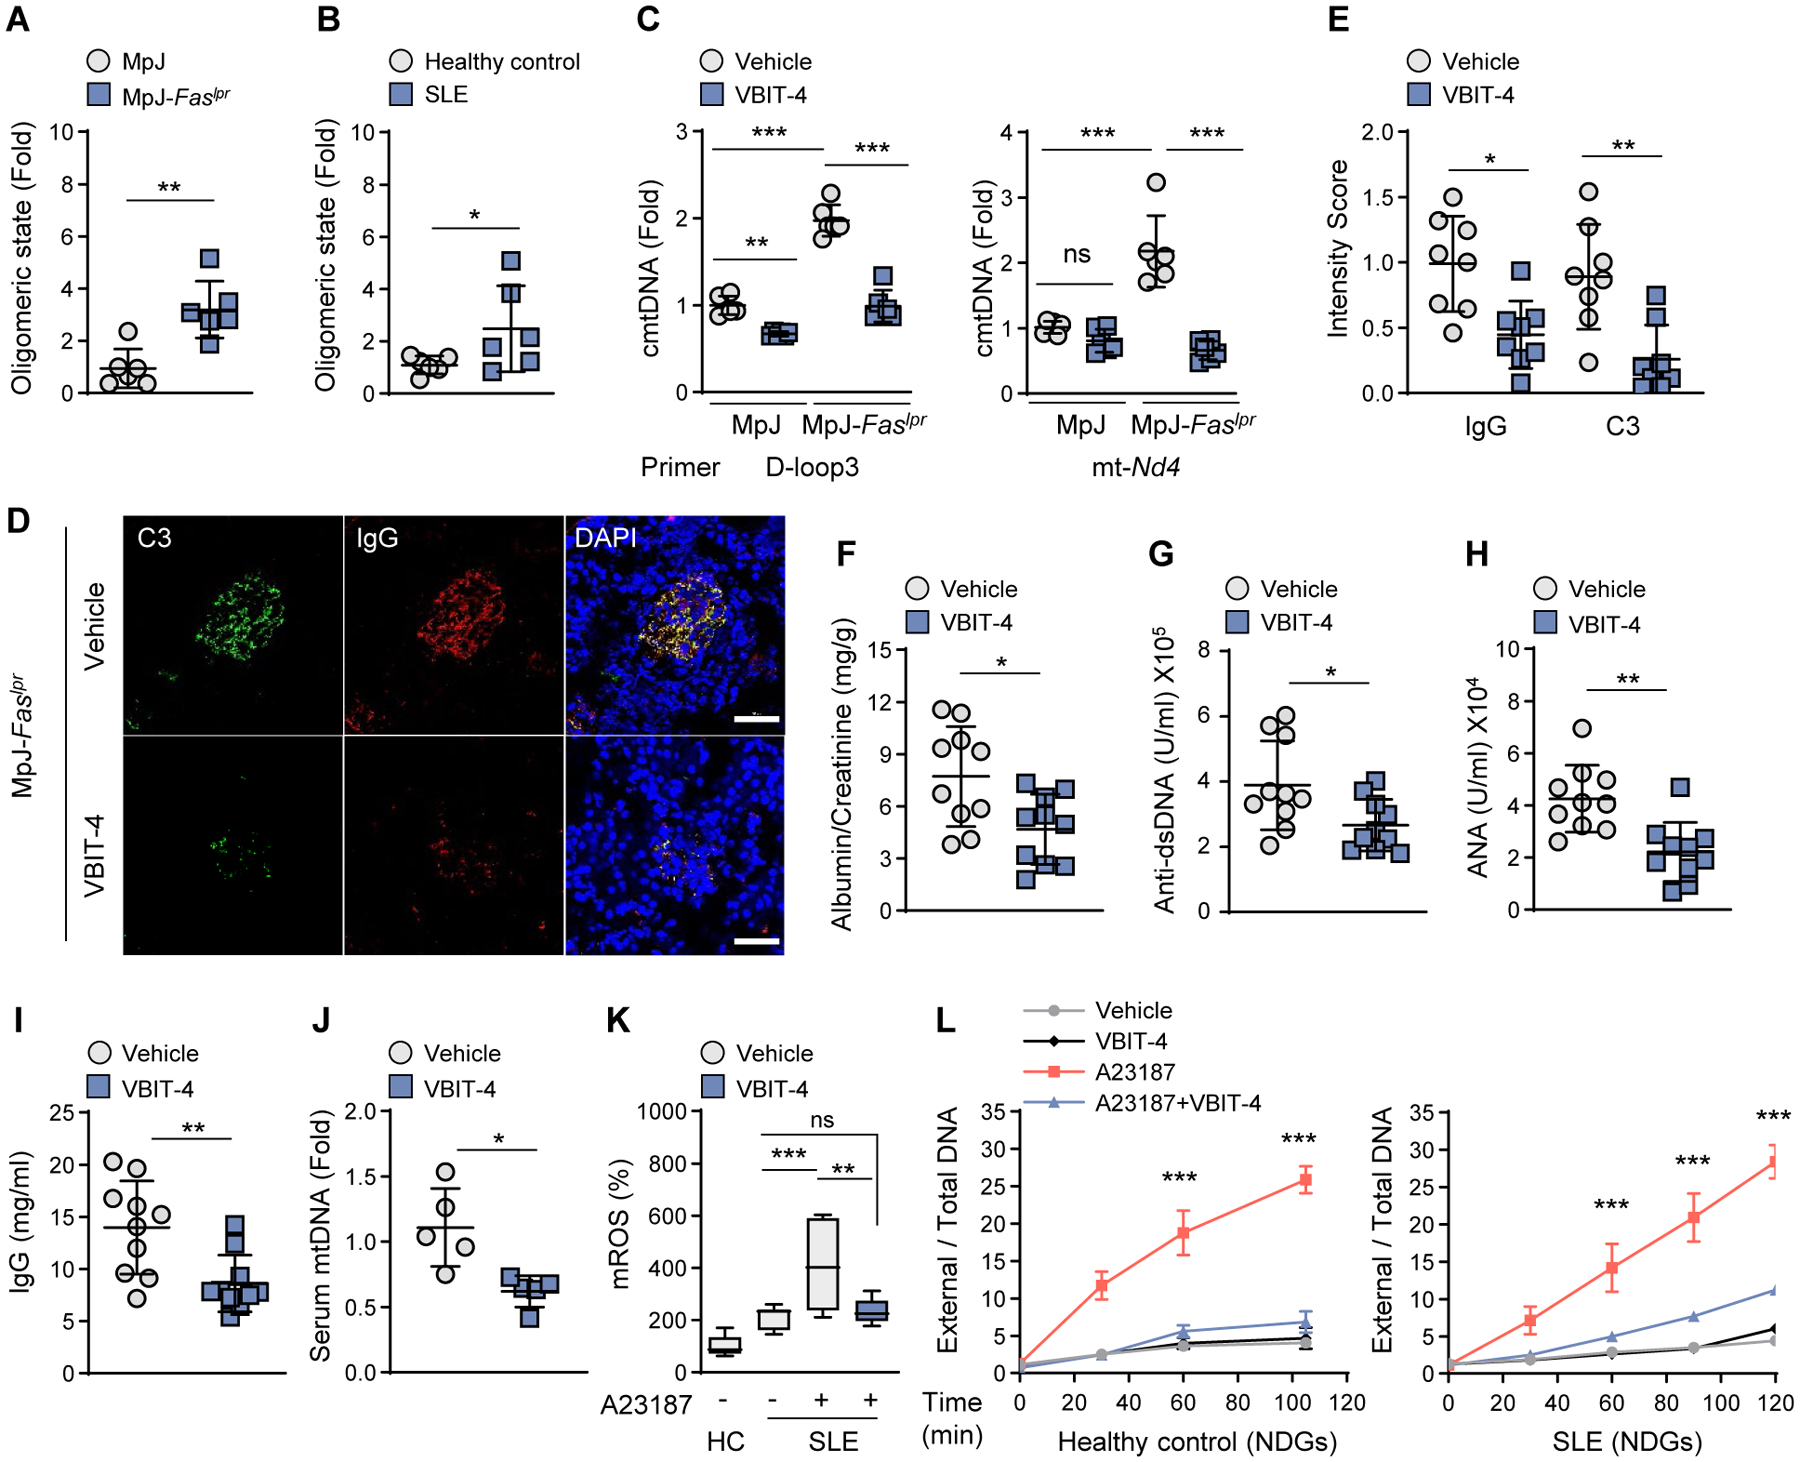
Mitochondrial stress releases mitochondrial DNA (mtDNA) into the cytosol, thereby triggering the type Ι interferon (IFN) response. Mitochondrial outer membrane permeabilization, which is required for mtDNA release, has been extensively studied in apoptotic cells, but little is known about its role in live cells. We found that oxidatively stressed mitochondria release short mtDNA fragments via pores formed by the voltage-dependent anion channel (VDAC) oligomers in the mitochondrial outer membrane. Furthermore, the positively charged residues in the N-terminal domain of VDAC1 interact with mtDNA, promoting VDAC1 oligomerization. The VDAC oligomerization inhibitor VBIT-4 decreases mtDNA release, IFN signaling, neutrophil extracellular traps, and disease severity in a mouse model of systemic lupus erythematosus. Thus, inhibiting VDAC oligomerization is a potential therapeutic approach for diseases associated with mtDNA release.


Conflict of interest statement

Competing interests: None declared.

Figures

Fig. 1.
Fig. 1.. Endog-deficiency increases cmtDNA and type-I IFN signaling.
(A and B) Quantification of cmtDNA (A) and total mtDNA (B) in WT and Endog−/− MEFs. (C and D) ISG expression levels (C) and heat map analysis of RNAseq data (D) in WT and Endog−/− MEFs. (E and F) ISG expression levels in WT and Endog−/− MEFs as well as two independently generated ρ0 MEFs (ρ0 1 and ρ0 2) were determined by immunoblotting (E) and RT-qPCR (F). (G) ISG expression was measured in WT and Endog−/− MEFs after treatment with Mito(M)-TEMPO (10 μM) for 48 h. All values are presented as the mean ± SEM of at least three independent experiments. *p < 0.05; **p < 0.01; ***p < 0.005; nd, not detected; ns, not significant.
Fig. 2.
Fig. 2.. VDAC oligomerization is required for mtDNA fragment release.
(A) ISG expression levels in WT and Vdac1/3−/− MEFs. (B) cmtDNA levels were determined in WT and Vdac1/3−/− MEFs after treatment with H2O2 (100 μM) for 18 h. (C) ISG expression levels were measured in WT and Vdac1/3−/− MEFs after knocking down Endog. (D and E) cmtDNA (D) and ISG expression (E) levels were measured after treatment with VBIT-4 (10 μM) in Endog−/− MEFs. (F) VDAC1 oligomerization-dependent release of mtDNA from mtDNA-loaded liposomes and inhibition by VBIT-4. (G) Fragment-size distribution of the fimtDNA and cmtDNA. All values are presented as the mean ± SEM of at least three independent experiments. *p < 0.05; **p < 0.01; ***p < 0.005; ns, not significant.
Fig. 3.
Fig. 3.. mtDNA interacts with VDAC1 and stabilizes its oligomeric state.
(A) Schematic diagram of VDAC1 oligomerization accompanied by the N-terminal domain (red) translocation into the large oligomer pore. We could not characterize VDAC3 in vitro because it tends to form aggregates. (B and C) mtDNA-induced oligomerization of purified VDAC1 was visualized by immunoblotting after treatment with the cross-linking reagent EGS to stabilize the oligomers during electrophoresis (B). Quantitative analysis of oligomers is shown (C). (D) mtDNA binding to VDAC1 in WT and Endog−/− MEFs. (E to G) VDAC1 (E) and BAK (G) oligomerization in WT, Endog−/− and Endog−/− ρ0 MEFs was visualized by immunoblotting. The positions of VDAC1 monomers (Mono), dimers (Di), trimers (Tri) and multimers (Multi) are indicated. NSB, non-specific band. Quantitative analysis of VDAC1 oligomers is shown (F). (H) ISG expression was measured in WT and Endog−/− MEFs after treatment with the BAX oligomerization inhibitor (BAI) (2 μM) for 24 h. (I) The amino-acid sequence of the VDAC1 N-terminal peptide. The positively charged amino acids were mutated to alanine (A: red color). (J) Direct interaction of mtDNA fragments with WT and 3A N-terminal 26 amino-acid peptides. (K) ISG expression levels were measured by RT-qPCR after H2O2 (100 μM) treatment for 18 h in MEFs expressing either WT or 3A VDAC1. All values are presented as the mean ± SEM of at least three independent experiments. *p < 0.05; **p < 0.01; ***p < 0.005; ns, not significant.
Fig. 4.
Fig. 4.. VDAC1 oligomerization inhibitor VBIT-4 ameliorates lupus-like disease.
(A) The formation of VDAC1 oligomers in splenocytes of MRL/MpJ-Faslpr lupus-prone mice and MRL/MpJ control mice (see fig. S11B; n=6 in each group). (B) Oligomeric state of VDAC1 in PBMC of healthy control and SLE patients (see fig. S11C; N=6 in each group). (C) cmtDNA levels were measured in splenocytes (A) after treatment with VBIT-4 (10 μM). (D and E) Kidney glomeruli of VBIT-4-treated mice, stained with antibodies against complement C3 (green) and IgG (red). Nuclei were stained with Hoechst (blue). Scale bars, 20 μm (D). Fluorescence intensity of C3 and IgG in (D) (n=8 in each group) (E). (F to I) Urinary albumin:creatinine ratio (F), serum anti-dsDNA levels (G), ANA levels (H), and IgG levels (I) of VBIT-4-treated mice (n=10 in each group). (J) Serum cell-free mtDNA levels of VBIT-4-treated mice (n=5 in each group). (K) mROS levels were measured by mitoSOX in PBMCs of healthy controls (HC) and SLE patients (n = 3 in each group). (L) A23187-induced NET formation by NDGs either from HC or SLE subjects was measured by SYTOX-PicoGreen plate assay (n=3 in each group). All values are presented as the mean ± SEM. *p < 0.05; **p < 0.01; ***p < 0.005; ns, not significant.

Comment in

References

    1. West AP, Shadel GS, Mitochondrial DNA in innate immune responses and inflammatory pathology. Nat Rev Immunol 17, 363–375 (2017). - PMC - PubMed
    1. McArthur K et al., BAK/BAX macropores facilitate mitochondrial herniation and mtDNA efflux during apoptosis. Science 359, (2018). - PubMed
    1. Rongvaux A et al., Apoptotic caspases prevent the induction of type I interferons by mitochondrial DNA. Cell 159, 1563–1577 (2014). - PMC - PubMed
    1. White MJ et al., Apoptotic caspases suppress mtDNA-induced STING-mediated type I IFN production. Cell 159, 1549–1562 (2014). - PMC - PubMed
    1. Keinan N, Tyomkin D, Shoshan-Barmatz V, Oligomerization of the mitochondrial protein voltage-dependent anion channel is coupled to the induction of apoptosis. Mol Cell Biol 30, 5698–5709 (2010). - PMC - PubMed

Publication types

MeSH terms