. 2019 Dec 19;10(1):5791.
doi: 10.1038/s41467-019-13433-6.

Edematous severe acute malnutrition is characterized by hypomethylation of DNA

Affiliations

Edematous severe acute malnutrition is characterized by hypomethylation of DNA

Katharina V Schulze et al. Nat Commun. .

Abstract

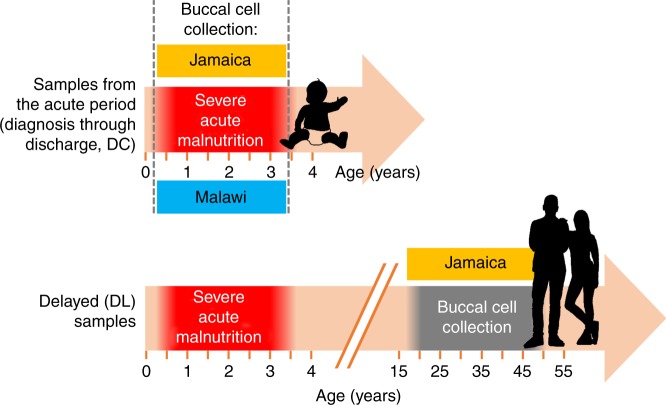
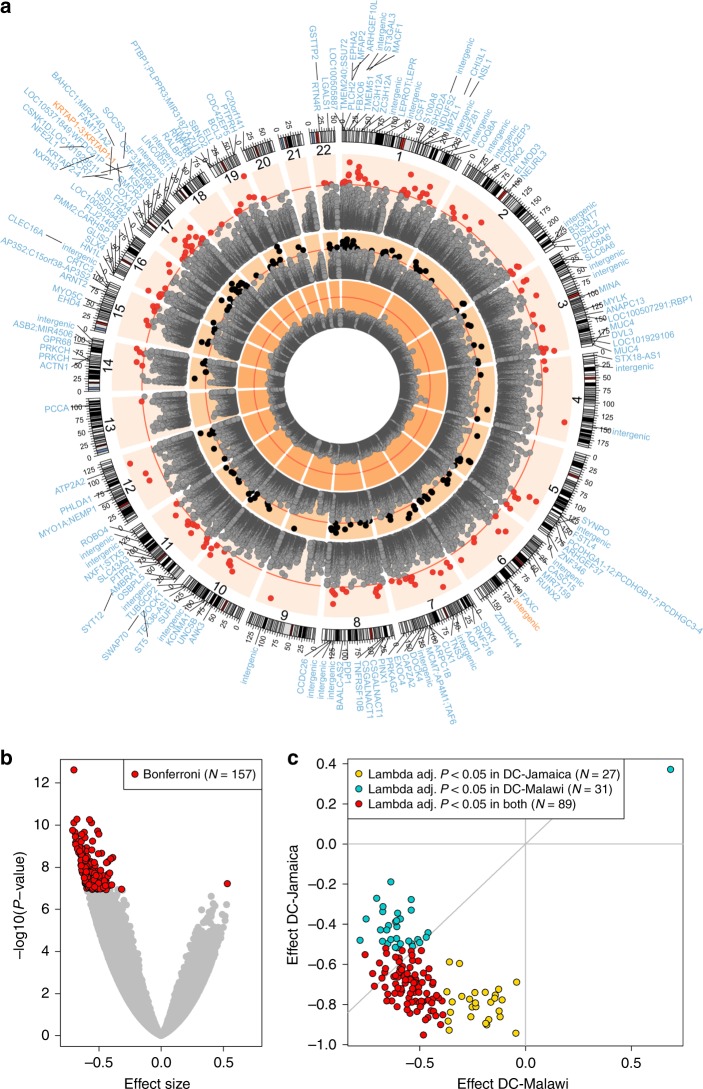
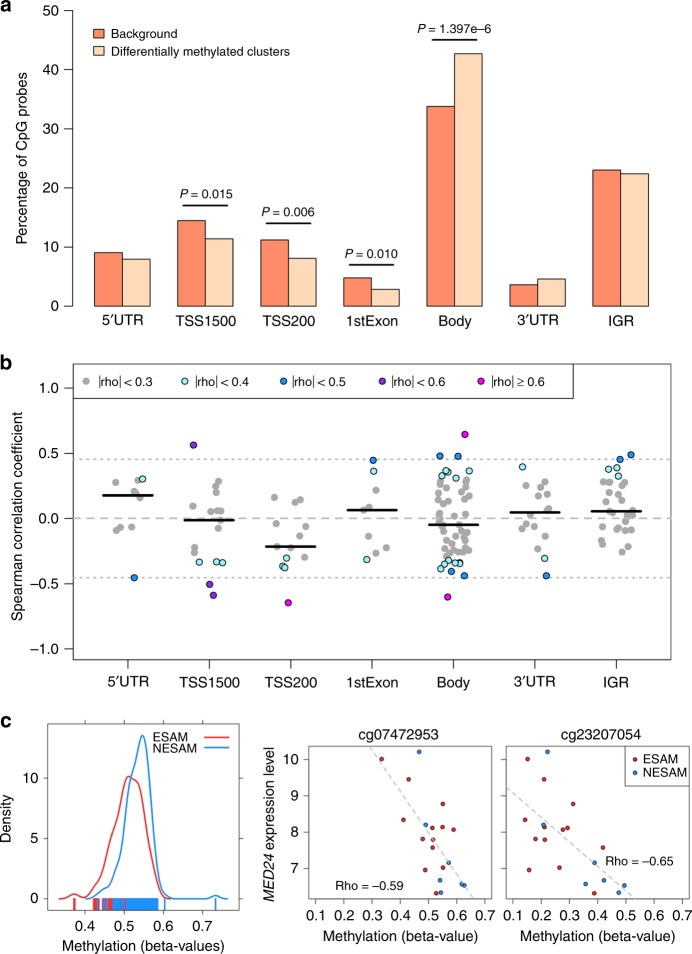
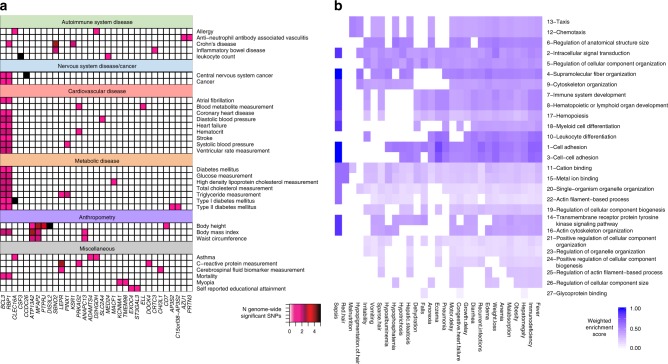
Edematous severe acute childhood malnutrition (edematous SAM or ESAM), which includes kwashiorkor, presents with more overt multi-organ dysfunction than non-edematous SAM (NESAM). Reduced concentrations and methyl-flux of methionine in 1-carbon metabolism have been reported in acute, but not recovered, ESAM, suggesting downstream DNA methylation changes could be relevant to differences in SAM pathogenesis. Here, we assess genome-wide DNA methylation in buccal cells of 309 SAM children using the 450 K microarray. Relative to NESAM, ESAM is characterized by multiple significantly hypomethylated loci, which is not observed among SAM-recovered adults. Gene expression and methylation show both positive and negative correlation, suggesting a complex transcriptional response to SAM. Hypomethylated loci link to disorders of nutrition and metabolism, including fatty liver and diabetes, and appear to be influenced by genetic variation. Our epigenetic findings provide a potential molecular link to reported aberrant 1-carbon metabolism in ESAM and support consideration of methyl-group supplementation in ESAM.


Conflict of interest statement

J.W.B. and X.W. are fulltime employees of Illumina Inc., but all work relevant to the current study was performed whilst they were employees of Baylor College of Medicine. The remaining authors have no competing interests to declare.

Figures

Fig. 1
Fig. 1
Overview of sampling timeline across both cohort locations and time points.
Fig. 2
Fig. 2. DNA hypomethylation in ESAM.
a The genome position of each locus is plotted against its −log10(P value). Depicted, from the inner to the outermost ring, are the recovered (DL) single site, acute (DC) single site, and DC cluster-based differential methylation results. Red lines mark the Bonferroni threshold of significance for each analysis. Black (N = 157) and red dots (N = 166) pass this significance threshold, in their respective analyses. Gene symbols around the plot perimeter represent the gene(s) within 10 kb of the significantly differentially methylated clusters (outer ring). Gene symbols in blue are hypomethylated in ESAM, gene symbols in orange are hypermethylated. b Volcano plot of effect sizes among all DC single sites. c Concordance of effect size and adjusted statistical significance between Jamaica and Malawi DC samples at the N = 157 Bonferroni-significant single CpG sites; ten sites were found to be age-sensitive in each of the country-specific analyses and were omitted (Methods). All P values are based on t test results from regression analyses.
Fig. 3
Fig. 3. Gene feature enrichment and expression analysis.
a Gene annotation enrichment analysis for CpG probes within significant differentially methylated clusters (DMCs) from the analysis of acutely malnourished children. P values were calculated with hypergeometric tests of depletion or enrichment comparing N = 420,500 of all tested, background CpG probes with the subset of N = 630 CpG probes found within DMCs. b Intraindividual correlation (Spearman) between mean methylation and mean expression of highly expressed genes within 10 kb in 20 additional Malawian children with SAM at individual CpG probes within significant DMCs. Horizontal dark bars represent median correlation coefficients, dashed line shows correlation of zero, and dotted lines indicate thresholds beyond which correlations reach statistical significance (algorithm AS 89 t test, P < 0.05). 5′UTR: 5-prime untranslated region, TSS1500: within 1500 bp distance to transcription start site, TSS200: within 200 bp distance to transcription start site, 3′UTR: 3-prime untranslated region, IGR: intergenic region. c Beta-value methylation levels by SAM type in DMC overlapping MED24 (left panel, NESAM = 164 samples, NNESAM = 145 samples) next to scatterplots showing the relationship between methylation levels of probes within the MED24 containing DMC and the expression values of MED24 (middle and right panel). Gray dashed lines show a linear model fit, while rho values indicate Spearman correlation coefficients. Source data for panels a and c (density plot) are provided as Source Data file.
Fig. 4
Fig. 4. Disease gene enrichment in ESAM.
a Experimental Factor Ontologies (EFOs) from the GWAS catalog (Methods) with two or more genes represented among ESAM differentially methylated clusters (DMCs) are shown on the vertical axis and grouped according to their shared parent EFOs. The overlap between disease and gene is indicated by a shaded box. The color key associated with each box represents the number of genome-wide significant SNPs for each gene for the listed EFO. b Weighted enrichment values for gene ontologies enriched by study DMCs (SGOs; vertical axis) and phenotypes associated with kwashiorkor (KGOs; horizontal axis) in the Human Phenotype ontology (HPO). SGOs that are not found in the KGO list receive a value of 0 by default, and SGOs that are found in the KGO list and in the top quartile of both lists would have a value of 1. Ranking of SGOs is indicated in descending order by the number in front of the SGO term and was based on their aggregate weighted enrichment score.
Fig. 5
Fig. 5. A model of nutrition-sensitive methylation quantitative trait loci (meQTLs).
a Scatterplot of the slopes of the regressions (β1) of SNP genotype on CpG methylation (meQTLs) at significant DMCs in acute (DC) ESAM and NESAM samples (N = 1885 SNP−DMC pairs). FDR-significant DMCs with meQTLs showing a significant interaction (t test, P ≤ 0.05) between ESAM and NESAM DC samples, but not among DL samples (N = 162) are highlighted in black; similar meQTLs found at Bonferroni-significant DMCs (N = 16) are in red. b log10 transformed P values of 162 meQTLs with a significant interaction; each dot represents values for the same SNP−CpG pair between acute (DC NESAM vs. DC ESAM) and recovered (DL NESAM vs. DL ESAM) individuals. c Disease context-dependent meQTLs at LINC01016. Methylation beta values (y axis) and genotypes (x axis) are shown for two adjacent SNP−CpG pairs (one SNP—two CpGs) illustrating a significant ESAM−NESAM interaction (t test, P ≤ 0.05; positive regression slope) in acute (DC, top and bottom left panels, NESAM = 53 samples, NNESAM = 37 samples) but not recovered SAM (DL, top and bottom right panels, NESAM = 23 samples, NNESAM = 25 samples). Boxplot center lines are medians, box boundaries are first and third quartile, and whiskers extend to data points found within 1.5 times the length of inter quartile range from the median.

References

    1. Black RE, et al. Maternal and child undernutrition and overweight in low-income and middle-income countries. Lancet. 2013;382:427–451. doi: 10.1016/S0140-6736(13)60937-X. - DOI - PubMed
    1. Bhutta ZA, et al. Severe childhood malnutrition. Nat. Rev. Dis. Prim. 2017;3:17067. doi: 10.1038/nrdp.2017.67. - DOI - PMC - PubMed
    1. M. H. N. Golden, M. H. N. & Golden, B. E. Severe Malnutrition Vol. 3. Oxford Textbook of Medicine. 1278−1296 (Oxford, 1996).
    1. Williams CD, Oxon BM, Lond H. Kwashiorkor: a nutritional disease of children associated with a maize diet. Lancet. 1935;226:1151–1152. doi: 10.1016/S0140-6736(00)94666-X. - DOI - PMC - PubMed
    1. Davies JN. The essential pathology of kwashiorkor. Lancet. 1948;1:317–320. doi: 10.1016/S0140-6736(48)92087-X. - DOI - PubMed

Publication types

MeSH terms