. 2019 Dec 19;10(1):5784.
doi: 10.1038/s41467-019-13722-0.

Helix 8 is the essential structural motif of mechanosensitive GPCRs

Affiliations

Helix 8 is the essential structural motif of mechanosensitive GPCRs

Serap Erdogmus et al. Nat Commun. .

Abstract

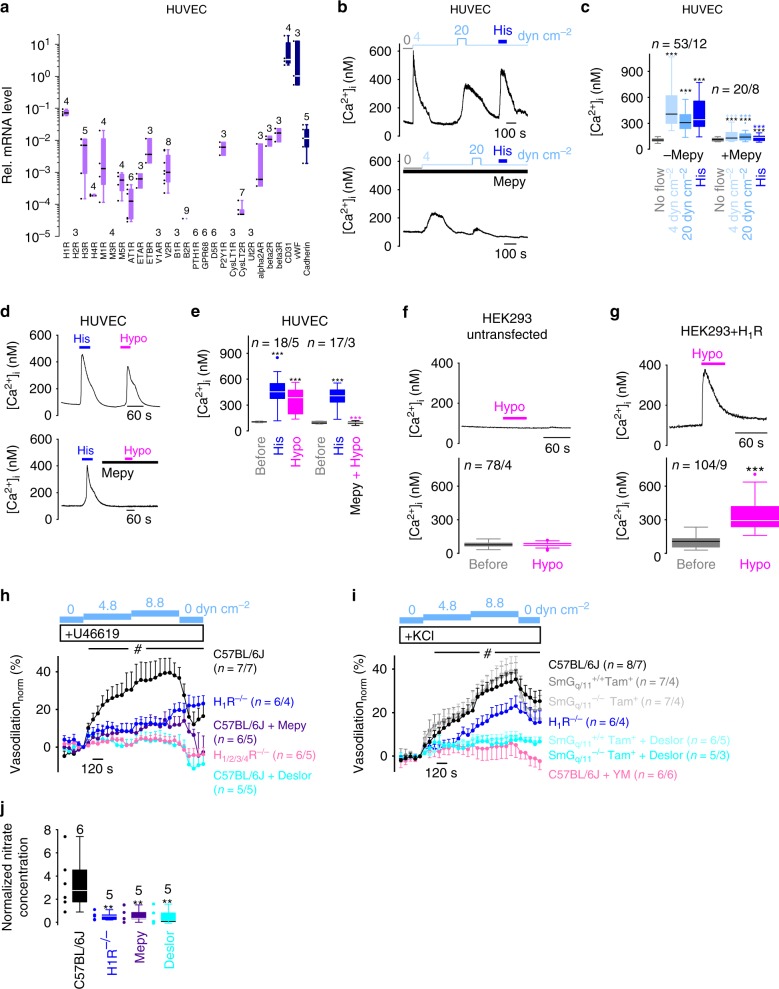
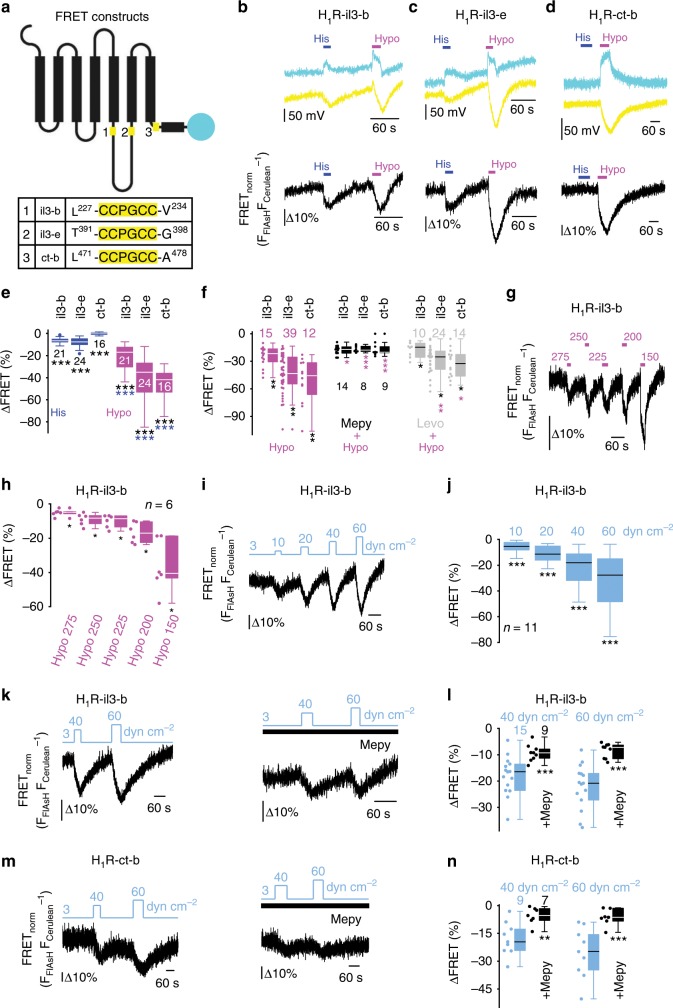
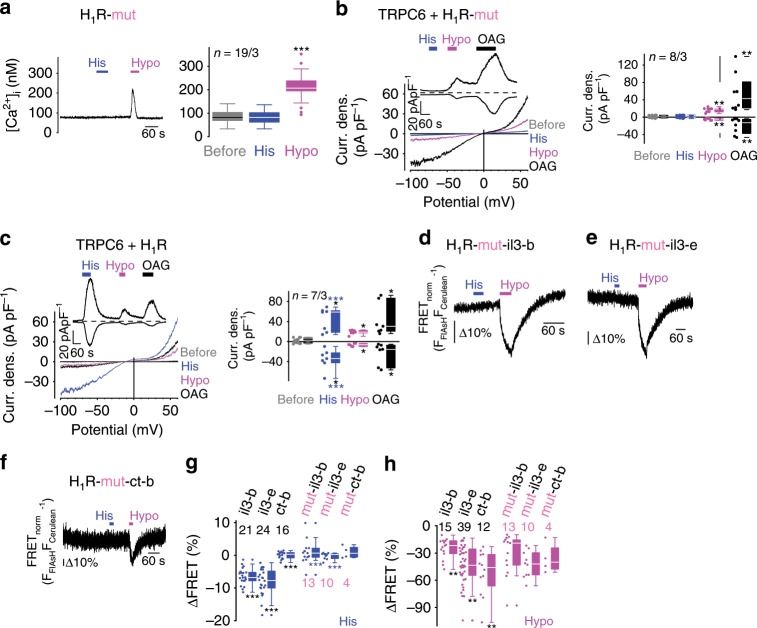
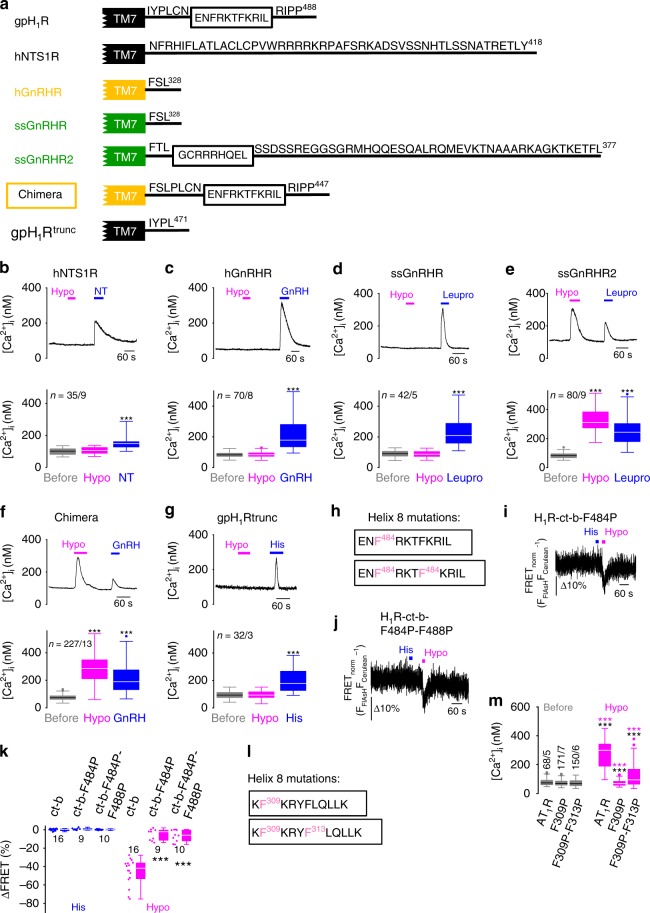
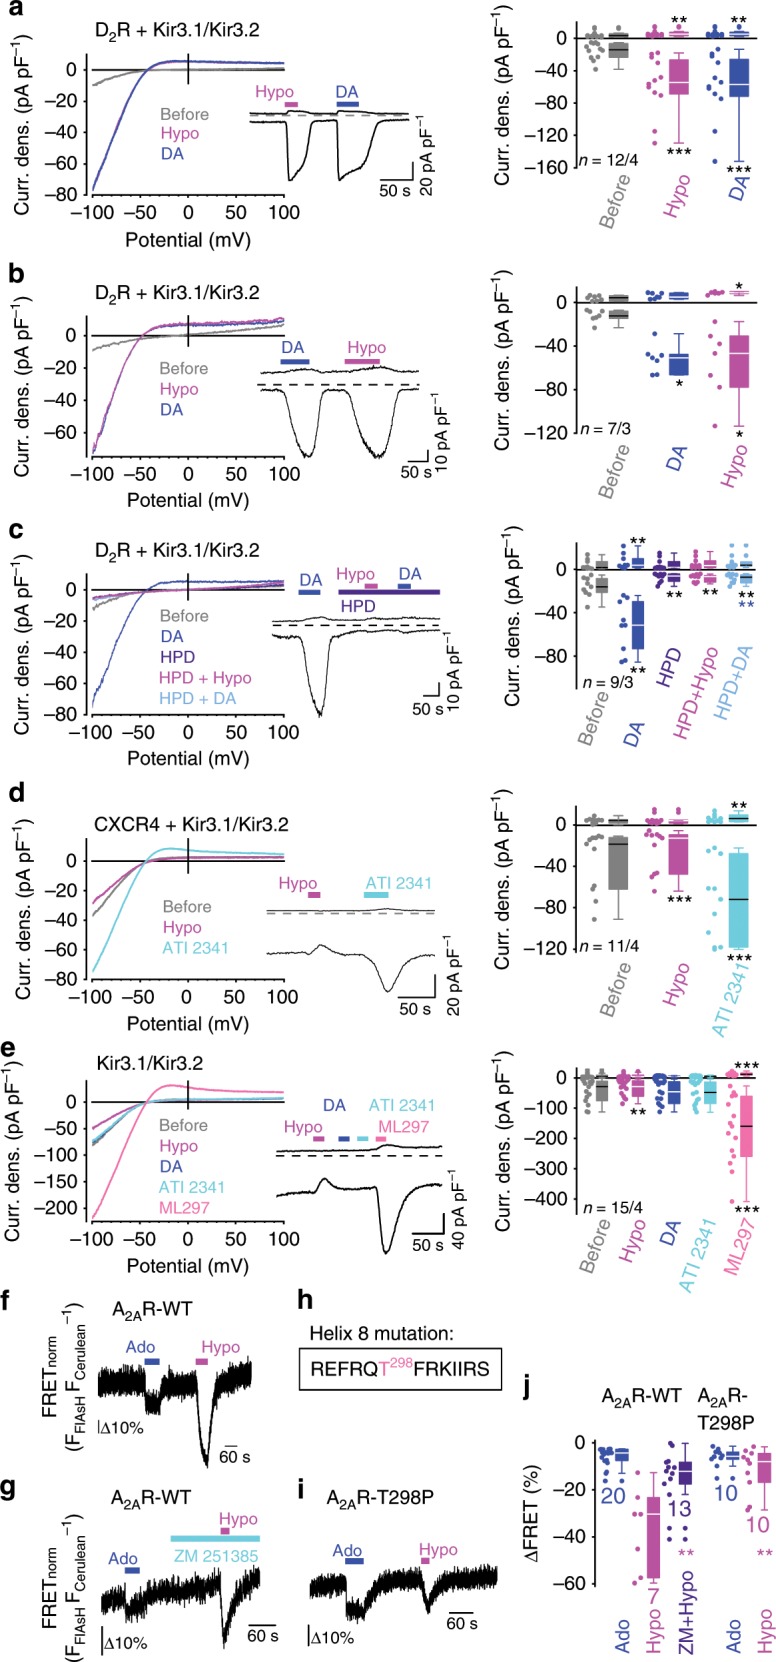
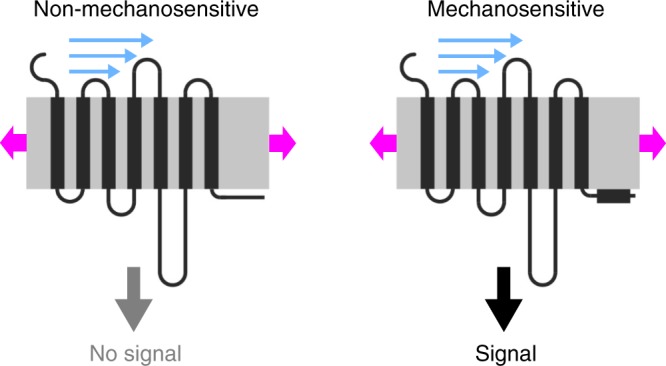
G-protein coupled receptors (GPCRs) are versatile cellular sensors for chemical stimuli, but also serve as mechanosensors involved in various (patho)physiological settings like vascular regulation, cardiac hypertrophy and preeclampsia. However, the molecular mechanisms underlying mechanically induced GPCR activation have remained elusive. Here we show that mechanosensitive histamine H1 receptors (H1Rs) are endothelial sensors of fluid shear stress and contribute to flow-induced vasodilation. At the molecular level, we observe that H1Rs undergo stimulus-specific patterns of conformational changes suggesting that mechanical forces and agonists induce distinct active receptor conformations. GPCRs lacking C-terminal helix 8 (H8) are not mechanosensitive, and transfer of H8 to non-responsive GPCRs confers, while removal of H8 precludes, mechanosensitivity. Moreover, disrupting H8 structural integrity by amino acid exchanges impairs mechanosensitivity. Altogether, H8 is the essential structural motif endowing GPCRs with mechanosensitivity. These findings provide a mechanistic basis for a better understanding of the roles of mechanosensitive GPCRs in (patho)physiology.


Conflict of interest statement

The authors declare no competing interests.

Figures

Fig. 1
Fig. 1. The endothelial H1R is a sensor of shear stress.
a mRNA expression of GPCRs and endothelial markers in HUVEC. CD31 cluster of differentiation 31, vWF von Willebrand factor, Cadherin vascular endothelial cadherin. Numbers indicate numbers of independent experiments. bg Calcium imaging measurements. b, d, f, g Representative traces of [Ca2+]i. Applications of shear stress, 100 µM histamine (His), 30 µM (d) or 100 µM (b) mepyramine (Mepy) and hypoosmotic solution (Hypo, 150 mOsm kg-1). c, eg Summaries of [Ca2+]i. (c) ***P < 0.001, black asterisks; Wilcoxon matched-pairs signed-rank test to compare to no flow conditions and ***P < 0.001, blue asterisks; Mann–Whitney U test to compare [Ca2+]i in the presence or absence of mepyramine. e ***P < 0.001, black asterisks; Wilcoxon matched-pairs signed-rank test to compare to basal [Ca2+]i. ***P < 0.001, magenta asterisks; Mann–Whitney U test to compare hypoosmotically induced [Ca2+]i signals in the presence and absence of mepyramine. f, g ***P < 0.001; Wilcoxon matched-pairs signed-rank test to compare to basal [Ca2+]i. h, i Summaries of flow-induced vasodilations with murine mesenteric artery segments. Wild-type arteries (C57BL/6 J) without and with incubation of 100 µM mepyramine (Mepy), 30 µM desloratadine (Deslor) or 100 nM YM254890 (YM). Arteries from H1R−/− and H1/2/3/4R−/− mice. Tamoxifen-induced, smooth muscle-specific Gq/11-protein knock-down arteries (SmGq/11−/−Tam+) and tamoxifen-treated WT littermates (SmGq/11+/+Tam+) in the presence and absence of 30 µM desloratadine. n indicates the number of arteries and the number of mice. Pre-constriction with 20 nM U46619 (h) or 35 mM KCL (i). #P < 0.05 from minute 8. Kruskal–Wallis test. Data are displayed as mean ± sem. j Summary of normalized nitrate concentrations in vessel perfusates from indicated arteries in the presence and absence of mepyramine or desloratadine. n indicates the number of independent experiments. **P < 0.01; Mann–Whitney U test compared to C57BL/6 J. c, eg n = x/y indicates the sample size, where x is the number of measured cells and y is the number of coverslips from at least 3 experimental days. a, c, eg, j Data are presented as boxplots (median plus interquartile range (IQR) and whiskers (max. 1.5-fold IQR)). See also Supplementary Fig. 1. Source data are provided as a Source Data file.
Fig. 2
Fig. 2. H1R adopts distinct mechanically induced conformations.
a Schematic depiction of H1R-FRET constructs with C-terminally attached cerulean and insertion of a FlAsH-binding motif (‘CCPGCC’) at different positions in the receptor: at the N-terminal beginning (il3-b) and at the C-terminal end (il3-e) of the third intracellular loop and at the beginning of the C-terminus (ct-b). Positions of the FlAsH-binding motif are highlighted in yellow. bd Representative traces of histamine (His) and membrane stretch-induced (Hypo) fluorescence changes. Fluorescence intensity was measured as voltage of the transimpedance amplifier. Cyan traces represent cerulean and yellow traces FlAsH fluorescence. Black traces show normalized FRET signals. e, f Summaries of FRET signal changes. e Histamine-(blue) and hypoosmotically induced FRET changes (magenta). ***P < 0.001, blue asterisks; Wilcoxon signed-rank test to compare histamine- and mechanically induced FRET changes, and ***P < 0.001, black asterisks; Kruskal–Wallis test to compare histamine- and mechanically induced FRET changes. f Mechanically induced FRET changes in the absence (Hypo, magenta) and presence (Hypo + Mepy, black and Hypo + Levo, gray) of 30 µM mepyramine or 10 µM levocetirizine. *P < 0.05, **P < 0.01, ***P < 0.001, magenta asterisks; Mann–Whitney U test to compare hypoosmotically induced FRET responses in the presence and absence of inverse agonists and **P < 0.01, black asterisks; Kruskal–Wallis test to compare mechanically induced FRET changes. g Representative trace of hypoosmotically induced FRET signal changes of the H1R-il3-b construct and application of different hypoosmotic solutions (275, 250, 225, 200 and 150 mOsm kg-1). h Summary of FRET changes. *P < 0.05; Wilcoxon signed-rank test. i, k, m Representative FRET measurements with application of shear stress. j, l, n Summaries of shear stress-induced FRET signal changes in the presence and absence of 100 µM mepyramine (Mepy) (j) **P < 0.01; Wilcoxon signed-rank test. l and n **P < 0.01, ***P < 0.001; Mann–Whitney U test. Numbers indicate numbers of measured cells from at least 3 experimental days. n indicates the number of measured cells from three experimental days. Data are displayed as boxplots (median plus interquartile range (IQR) and whisker (max. 1.5-fold IQR)). See also Supplementary Figs. 2, 3, 4. Source data are provided as a Source Data file.
Fig. 3
Fig. 3. Mechanical H1R activation is independent of agonist binding.
a Calcium imaging of fura-2 loaded HEK293 cells overexpressing H1R with two amino acid exchanges (D116A and F433A; H1R-mut) resulting in disruption of histamine binding. Representative trace of [Ca2+]i with applications of 100 µM histamine (His) and of hypoosmotic solution (Hypo, 150 mOsm kg-1) and summary of [Ca2+]i are displayed. ***P < 0.001; Wilcoxon matched-pairs signed-rank test to compare to basal [Ca2+]i (‘before’). b, c Whole-cell measurements of HEK293 cells co-expressing TRPC6 and the H1R-mutant (b) or wild-type H1R (c). Representative current density (Curr. dens.)-voltage curves (left) and current density-time courses (insets) with application of 100 µM histamine (His), hypoosmotic bath solution with 250 mOsm kg-1 (Hypo) and of the TRPC6 activator 1-Oleoyl-2-acetyl-glycerol (OAG, 100 µM). Summaries of Current densities at holding potentials of ±60 mV before and during application of histamine, hypoosmotic bath solution and OAG (right). *P < 0.05, **P < 0.01, black asterisks; Wilcoxon matched-pairs signed-rank test to compare to basal current densities (‘before’) and ***P < 0.001, blue asterisks; Mann–Whitney U test to compare wild-type H1R and H1R-mutant. df Representative FRET measurements of indicated FRET constructs with impaired histamine binding. g, h Summaries of FRET signal changes induced by application of histamine (g) and of hypoosmotic solution (h). ***P < 0.001, blue asterisks; Mann–Whitney U test compared to wild-type and H1R-mutant FRET constructs and **P < 0.01, ***P < 0.001, black asterisks; Kruskal–Wallis test to compare all wild-type and H1R-mutant FRET constructs. ac n=x/y indicates the sample size, where x is the number of measured cells and y is the number of coverslips from at least 3 experimental days. ac, g, h Data are displayed as boxplots (median plus interquartile range (IQR) and whisker (max. 1.5-fold IQR)). See also Supplementary Figs. 2, 3. Source data are provided as a Source Data file.
Fig. 4
Fig. 4. H8 is essential for mechanosensation of Gq/11-protein coupled receptors.
a C-terminal amino acid sequences of indicated GPCRs. gpH1R, guinea pig H1R; hNTS1R, human neurotensin 1 receptor; hGnRHR, human gonadotropin-releasing hormone receptor; ssGnRHR and ssGnRHR2, short and long isoforms of the swine GnRH receptor; chimera, hGnRHR fused to the C-terminus of gpH1R; gpH1Rtrunc, C-terminally truncated gpH1R. TM7; transmembrane domain 7. Black frames indicate helix 8 (H8). For ssGnRHR2, the H8 position was predicted using the YASPIN secondary structure prediction program. For gpH1R and hNTS1R the H8 positions were predicted based on the crystal structures of the human H1R and the rat NTS1R. Numbers indicate positions of last amino acids. bg Calcium imaging with HEK293 cells overexpressing indicated receptors. Representative traces of [Ca2+]i. Applications of hypoosmotic solution (Hypo), of 200 nM neurotensin (NT, b), 200 nM GnRH (c and F), 200 nM leuprolide (Leupro, d and e) and 100 µM histamine (His, g) (upper panels). Summaries of [Ca2+]i (lower panels). ***P < 0.001; Wilcoxon matched-pairs signed-rank test to compare to basal [Ca2+]i. h Amino acid sequence of H8 of the H1R-c-tb construct with amino acid exchanges to proline. ik FRET measurements of H8 mutant constructs. I, j Representative FRET measurements. k Summary of FRET signal changes. ***P < 0.001; Mann–Whitney U test to compare to the H1R-ct-b construct. l Amino acid sequence of H8 of the AT1R with amino acid exchanges to proline. m Summary of [Ca2+]i from HEK293 cells overexpressing AT1R and H8 mutants. ***P < 0.001; black asterisks, Wilcoxon matched-pairs signed-rank test to compare to basal [Ca2+]i before hypoosmotic stimulation. ***P < 0.001; magenta asterisks, Mann–Whitney U test to compare hypoosmotically induced [Ca2+]i to AT1R WT. bg, m n = x/y indicates the sample size, where x is the number of measured cells and y is the number of coverslips from at least 3 experimental days. k, m Numbers indicate the number of measured cells from at least 3 experimental days. bg, k, m Data are displayed as boxplots (median plus interquartile range (IQR) and whisker (max. 1.5-fold IQR)). See also Supplementary Figs. 3, 5, 6. Source data are provided as a Source Data file.
Fig. 5
Fig. 5. H8 is essential for mechanosensation of Gi/o- and Gs-protein coupled receptors.
ae Whole-cell measurements of CHO-K1 cells overexpressing Kir3.1/Kir3.2 channels alone (e) or in combination with the D2R (ac) or the CXCR4 (d). (left) Representative current density (Curr. dens.)-voltage curves and current density-time courses (insets) with application of hypoosmotic bath solution with 250 mOsm kg−1 (Hypo), 10 µM dopamine (DA), 10 µM haloperidol (HPD), 10 µM ATI 2341 and 3 µM of the Kir channel activator ML297 (above). (right) Summaries of current densities at holding potentials of ± 100 mV before and during mechanical and agonist stimulation. *P < 0.05, **P < 0.01, ***P < 0.001; Wilcoxon matched-pairs signed-rank test to compare to basal current densities before stimulation and **P < 0.01, blue asterisks to compare dopamine effects in the presence or absence of haloperidol. f, g, i, j FRET measurements of the A2AR FRET construct (A2AR-WT, f and g) and of the A2AR-T298P FRET construct (A2AR-T298P, i). h Position of amino acid exchange in H8 of the A2AR FRET construct to disrupt the helix structure. f, g, i Representative FRET measurements with application of 10 µM adenosine (Ado) and of hypoosmotic solution (Hypo) and of 10 µM of the A2AR blocker ZM 241385 (ZM). j Summary of adenosine and of mechanically induced FRET signal changes. **P < 0.01, magenta asterisks; Mann–Whitney U-test to compare mechanically induced FRET changes. ae, j Data are displayed as boxplots (median plus interquartile range (IQR) and whisker (max. 1.5-fold IQR)). ae n = x/y indicates the sample size, where x is the number of measured cells and y is the number of coverslips from at least three experimental days. j Numbers indicate the number of measured cells from at least three experimental days. See also Supplementary Fig. 3. Source data are provided as a Source Data file.
Fig. 6
Fig. 6. Model of mechanically induced GPCR activation.
Mechanosensation of GPCRs depends on the presence of an intact H8. GPCRs that lack H8 are non-mechanosensitive (left). An intact H8 stabilizes the mechanosensitive receptor conformation resulting in activation of GPCRs (right). Mechanical forces like membrane stretch and shear stress might cause elongation of H8 leading to G-protein activation and subsequent signal transduction resulting in large signals. GPCR is depicted in black. H8 is highlighted as black rectangular box. Gray box indicates the plasma membrane. Blue arrows display shear stress and magenta arrows display membrane stretch.

Comment in

References

    1. Hauser AS, Attwood MM, Rask-Andersen M, Schioth HB, Gloriam DE. Trends in GPCR drug discovery: new agents, targets and indications. Nat. Rev. Drug Disco. 2017;16:829–842. doi: 10.1038/nrd.2017.178. - DOI - PMC - PubMed
    1. Ben-Chaim Y, et al. Movement of ‘gating charge’ is coupled to ligand binding in a G-protein-coupled receptor. Nature. 2006;444:106–109. doi: 10.1038/nature05259. - DOI - PubMed
    1. Birk A, Rinne A, Bunemann M. Membrane potential controls the efficacy of catecholamine-induced beta1-adrenoceptor activity. J. Biol. Chem. 2015;290:27311–27320. doi: 10.1074/jbc.M115.665000. - DOI - PMC - PubMed
    1. Rinne A, Birk A, Bunemann M. Voltage regulates adrenergic receptor function. Proc. Natl Acad. Sci. USA. 2013;110:1536–1541. doi: 10.1073/pnas.1212656110. - DOI - PMC - PubMed
    1. Rinne A, Mobarec JC, Mahaut-Smith M, Kolb P, Bunemann M. The mode of agonist binding to a G protein-coupled receptor switches the effect that voltage changes have on signaling. Sci. Signal. 2015;8:ra110. doi: 10.1126/scisignal.aac7419. - DOI - PubMed

Publication types

MeSH terms

Substances

LinkOut - more resources