. 2019 Dec 19;9(1):19428.
doi: 10.1038/s41598-019-55948-4.

Electrophysiological correlates of the flexible allocation of visual working memory resources

Affiliations

Electrophysiological correlates of the flexible allocation of visual working memory resources

Christine Salahub et al. Sci Rep. .

Abstract

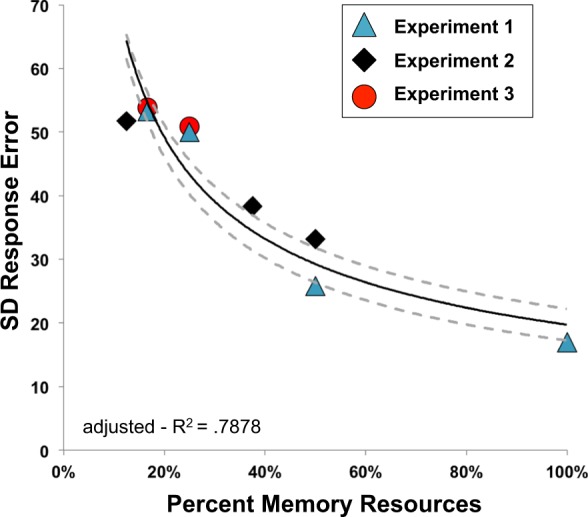
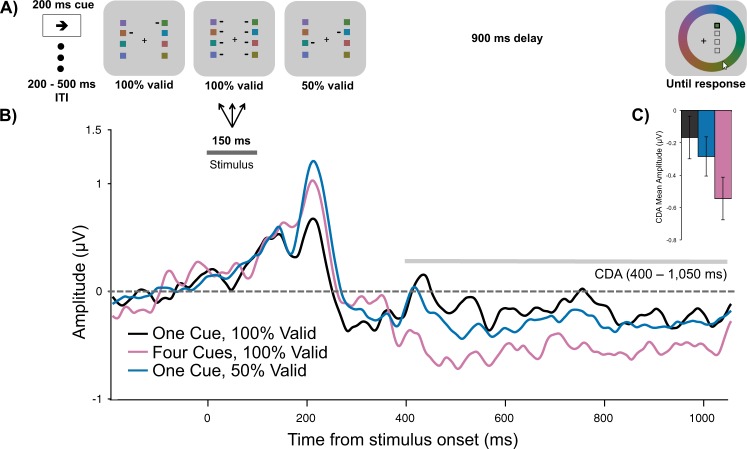
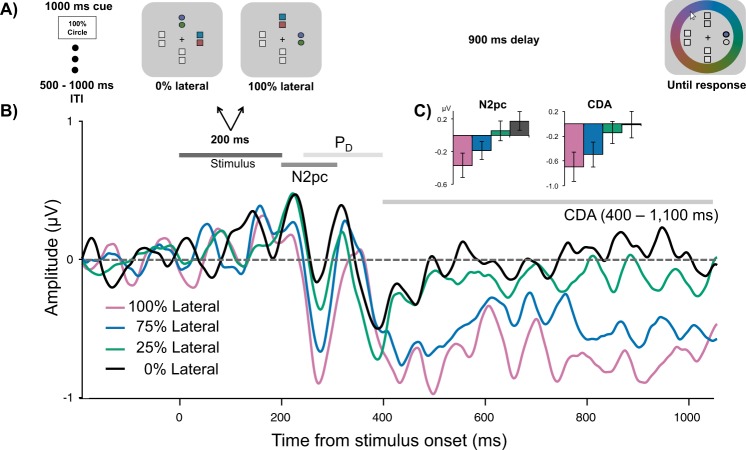
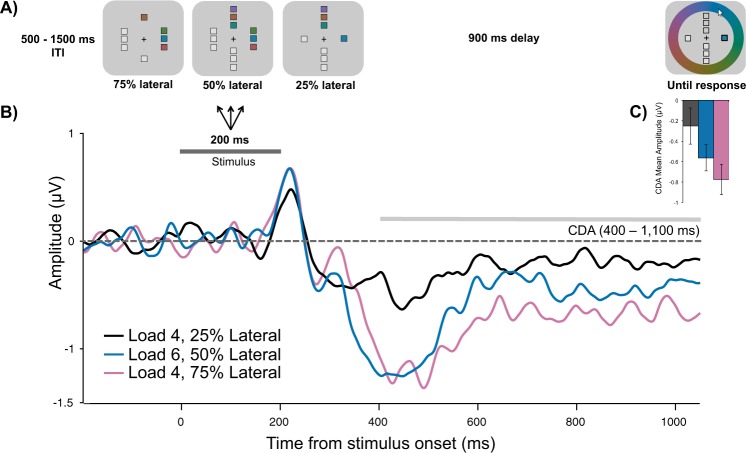
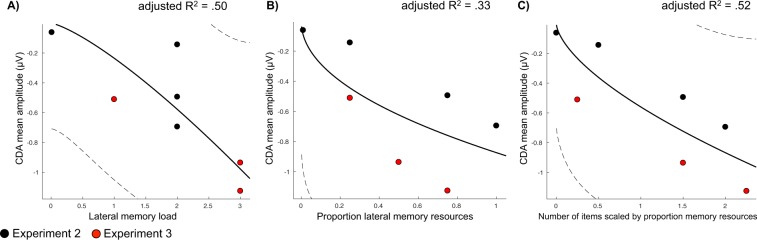
Visual working memory is a brief, capacity-limited store of visual information that is involved in a large number of cognitive functions. To guide one's behavior effectively, one must efficiently allocate these limited memory resources across memory items. Previous research has suggested that items are either stored in memory or completely blocked from memory access. However, recent behavioral work proposes that memory resources can be flexibly split across items based on their level of task importance. Here, we investigated the electrophysiological correlates of flexible resource allocation by manipulating the distribution of resources amongst systematically lateralized memory items. We examined the contralateral delay activity (CDA), a waveform typically associated with the number of items held in memory. Across three experiments, we found that, in addition to memory load, the CDA flexibly tracks memory resource allocation. This allocation occurred as early as attentional selection, as indicated by the N2pc. Additionally, CDA amplitude was better-described when fit with a continuous model predicted by load and resources together than when fit with either alone. Our findings show that electrophysiological markers of attentional selection and memory maintenance not only track memory load, but also the proportion of memory resources those items receive.


Conflict of interest statement

The authors declare no competing interests.

Figures

Figure 1
Figure 1
Standard deviation of raw response error by percent memory resources in each experiment, fit with a power-law. Dashed grey lines represent fits performed on the 95% confidence interval of the condition means.
Figure 2
Figure 2
(A) Task schematic of Experiment 1. (B) Grand average difference waveform (N = 20) at the average of 5 posterior channel pairs, time-locked to stimulus onset. Positive is plotted up. Filtered at 30 Hz for visualization purposes only. (C) Bar chart of mean CDA amplitudes in each condition. Error bars reflect within-subject 95% confidence intervals.
Figure 3
Figure 3
(A) Task schematic of Experiment 2. In this example, it was 100% likely that the color of a circle would be probed. (B) Grand average difference waveform (N = 20) at the average of 5 posterior channel pairs, time-locked to stimuli onset. Filtered at 30 Hz for visualization purposes only. (C) Bar chart of mean N2pc and CDA amplitudes in each condition. Error bars reflect within-subject 95% confidence intervals.
Figure 4
Figure 4
Repeated-measures correlations plots. Each colored line is the fit for three data points from each individual participant from the 100%, 75%, and 25% lateral likelihood conditions. (A) Correlation between N2pc mean amplitude and standard deviation (SD) of raw response error. Lower SD indicates more precise responding. (B) Correlation between CDA mean amplitude and SD of response error.
Figure 5
Figure 5
(A) Task schematic of Experiment 3. (B) Grand average difference waveform (N = 20) at the average of 5 posterior channel pairs, time-locked to stimuli onset. Positive is plotted up. Filtered at 30 Hz for visualization purposes only. (C) Bar chart of mean CDA amplitudes in each condition. Error bars reflect within-subject 95% confidence intervals.
Figure 6
Figure 6
Power-law models and fits. Dotted lines represent 95% CIs of the model fit. Black dots represent condition means from Experiment 2 and red dots from Experiment 3. (A) Fit between CDA mean amplitude and lateral memory load. (B) Fit between CDA amplitude and proportion lateral memory resources. (C) Fit between CDA amplitude and number of items scaled for both memory load and memory resources.

References

    1. Chun MM, Turk-Browne NB. Interactions between attention and memory. Curr. Opin. Neurobiol. 2007;17:177–184. doi: 10.1016/j.conb.2007.03.005. - DOI - PubMed
    1. deBettencourt MT, Norman KA, Turk-Browne NB. Forgetting from lapses of sustained attention. Psychon. Bull. Rev. 2017;25:605–611. doi: 10.3758/s13423-017-1309-5. - DOI - PMC - PubMed
    1. Sundby, C. S., Woodman, G. F. & Fukuda, K. Electrophysiological and behavioral evidence for attentional up-regulation, but not down-regulation, when encoding pictures into long-term memory. Mem. Cogn (2018). - PMC - PubMed
    1. Turk-Browne NB, Golomb JD, Chun MM. Complementary attentional components of successful memory encoding. NeuroImage. 2013;66:553–562. doi: 10.1016/j.neuroimage.2012.10.053. - DOI - PMC - PubMed
    1. Adam KCS, Mance I, Fukuda K, Vogel EK. The contribution of attentional lapses to individual differences in visual working memory capacity. J. Cogn. Neurosci. 2015;27:1601–1616. doi: 10.1162/jocn_a_00811. - DOI - PMC - PubMed

Publication types