. 2020 Apr;226(2):441-459.
doi: 10.1111/nph.16382. Epub 2020 Feb 11.

Auxin-induced actin cytoskeleton rearrangements require AUX1

Affiliations

Auxin-induced actin cytoskeleton rearrangements require AUX1

Ruthie S Arieti et al. New Phytol. 2020 Apr.

Abstract

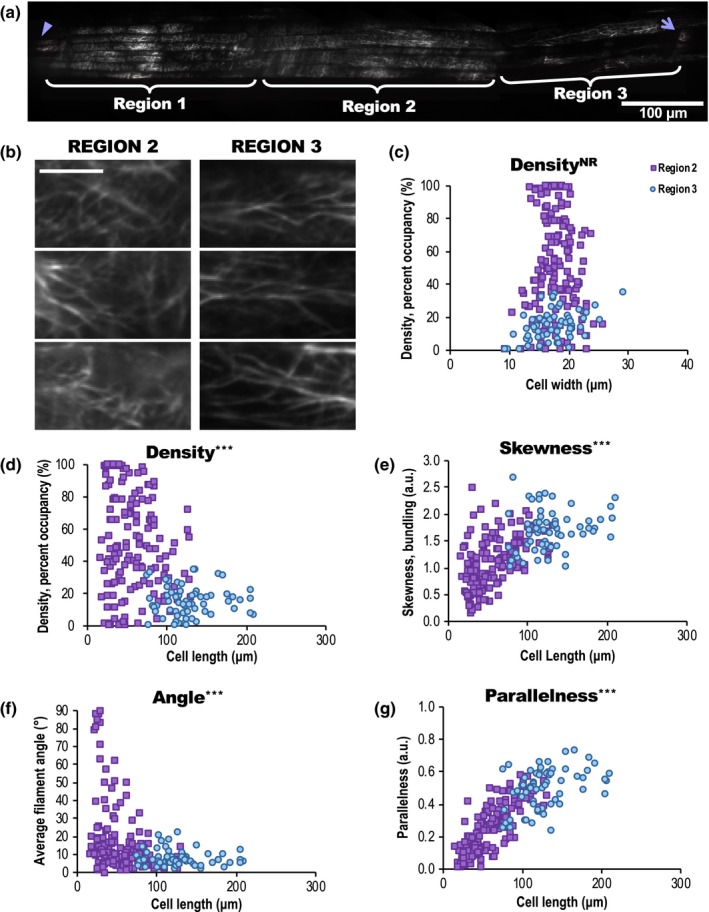
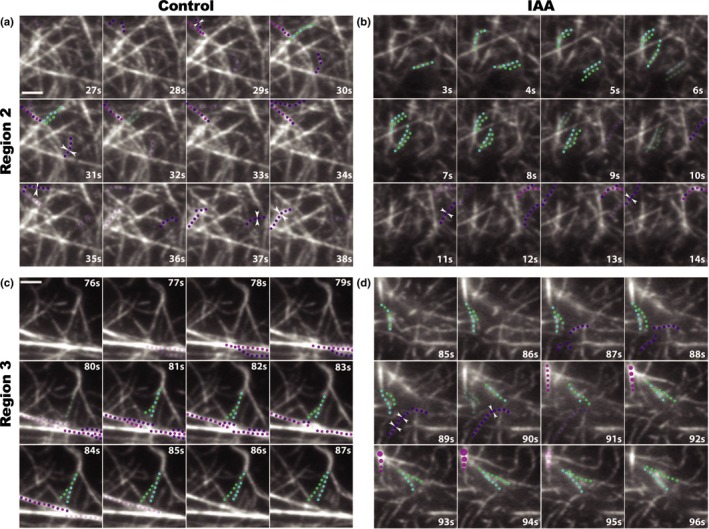
The actin cytoskeleton is required for cell expansion and implicated in cellular responses to the phytohormone auxin. However, the mechanisms that coordinate auxin signaling, cytoskeletal remodeling and cell expansion are poorly understood. Previous studies examined long-term actin cytoskeleton responses to auxin, but plants respond to auxin within minutes. Before this work, an extracellular auxin receptor - rather than the auxin transporter AUXIN RESISTANT 1 (AUX1) - was considered to precede auxin-induced cytoskeleton reorganization. In order to correlate actin array organization and dynamics with degree of cell expansion, quantitative imaging tools established baseline actin organization and illuminated individual filament behaviors in root epidermal cells under control conditions and after indole-3-acetic acid (IAA) application. We evaluated aux1 mutant actin organization responses to IAA and the membrane-permeable auxin 1-naphthylacetic acid (NAA). Cell length predicted actin organization and dynamics in control roots; short-term IAA treatments stimulated denser and more parallel, longitudinal arrays by inducing filament unbundling within minutes. Although AUX1 is necessary for full actin rearrangements in response to auxin, cytoplasmic auxin (i.e. NAA) stimulated a lesser response. Actin filaments became more 'organized' after IAA stopped elongation, refuting the hypothesis that 'more organized' actin arrays universally correlate with rapid growth. Short-term actin cytoskeleton response to auxin requires AUX1 and/or cytoplasmic auxin.

Keywords: AUX1; Arabidopsis; actin; auxin; cell expansion; cytoskeleton; signaling.


Figures

Figure 1
Figure 1
Actin organization is predictive of epidermal cell length in the root elongation zone. (a) Mosaic of root cap and elongation zone in an Arabidopsis thaliana seedling expressing green fluorescent protein fused to the second actin‐binding domain of Arabidopsis FIMBRIN1 (GFP‐fABD2) imaged with variable angle epifluorescence microscopy (VAEM). Arrowhead, root apex; arrow, first root hair initiation. mosaicj was used to compile 13 original VAEM images. Region 1 encompasses the root cap (root apex to c. 300 μm from the apex); Region 2 begins c. 300 μm from the apex and ends c. 625 μm from the apex; Region 3 begins c. 625 μm from the apex and ends at the first clearly visible root hair initiations, c. 860 μm from the apex. Bar, 100 μm. (b) Representative images of actin organization in two root regions. Bar, 10 μm. (c–g) Quantification of actin architecture or orientation in the root elongation zone, metrics plotted with respect to corresponding epidermal cell length (d–g), or cell width (c). Filament architecture and orientation were not predictable based on cell width but were highly correlated with cell length. Supporting Information Fig. S2 shows results for skewness, angle and parallelness vs cell width, which also showed no relationship, and Fig. S1 shows comparisons of mean measurements of actin from Region 2 (purple squares) and Region 3 (blue circles). Mean cell length ± 1 SD: Region 2 = 57 ± 28 μm, Region 3 = 128 ± 34 μm. n = 60–150 cells per region from 20 roots. a.u., arbitrary units. NR, no predictive relationship; ***, P ≤ 0.0001, Bivariate fit/ANOVA for all data points for each parameter. Results are from one experiment.
Figure 2
Figure 2
Timelapse imaging of cortical actin filaments in root epidermal cells shows differences in the dynamic behavior between short and long cells. (a, c) The cortical actin cytoskeleton in 6‐d‐old light‐grown Arabidopsis thaliana root epidermal cells expressing green fluorescent protein fused to the second actin‐binding domain of Arabidopsis FIMBRIN1 (GFP‐fABD2) was imaged with timelapse variable angle epifluorescence microscopy (VAEM). Representative images of individual filament dynamics in short cells (≤ 85 μm long, Region 2) and long cells (> 94 μm long, Region 3). On average, filaments in short cells (a; filament highlighted in purple) elongated over 25% more slowly and grew to be nearly 30% shorter than filaments in long cells (c; filament highlighted in blue). Severing frequencies and filament lifetimes did not vary between regions; see Table 1. Bars in (a) and (c), 5 μm. (b, d) Regions of interest (ROI; 227.7 μm2) were selected from the same movies as (a, c). Annealing occurs c. 10‐fold more frequently in short cells (b; filaments highlighted in purple) compared with long cells (d; filament highlighted in blue). Note that four annealing events (white arrowheads) occurred within 6 s in (b) compared with only one event in (d). Dots indicate fragments involved in annealing events. Quantification of annealing frequencies as well as bundling and unbundling frequencies are shown in Table 1. Although actin filament arrays in long cells were substantially more bundled compared with short cells (see Fig. 1), there were no differences in bundling or unbundling frequencies when event frequencies were calculated on a per‐minute, per‐filament basis. Bars in (b, d), 2 μm. 100‐s timelapse movies were collected from short and long cells in the same 30 roots. Note: brightness and contrast were enhanced in the montages of (b, c) to better show the filament and its changes.
Figure 3
Figure 3
Short‐term indole‐3‐acetic acid (IAA) treatments induce changes in actin filament organization. (a) Representative variable angle epifluorescence microscopy (VAEM) images of green fluorescent protein fused to the second actin‐binding domain of Arabidopsis FIMBRIN1 (GFP‐fABD2)‐labeled actin in Arabidopsis thaliana epidermal cells from Region 2 (≤ 85 μm long) and Region 3 (≥ 94 μm long), treated for 20–30 min with indicated doses of IAA or control. Bars, 10 μm. (b–e) Quantification of actin architecture and orientation in root epidermal cells: IAA triggered an increase in actin filament density (b) and decrease in skewness (c). Region 2 measurements are shown in purple; Region 3 in blue. (d,e) After IAA treatments, actin arrays in both regions were more ‘organized,’ with lower average filament angle (d) relative to the longitudinal axis of the cell and filaments generally more parallel to each other (e). Changes in actin orientation (d) and (e) were dose‐dependent, see Supporting Information Fig. S5. Cells whose lengths fell between 85 and 94 μm were counted in both regions. n = 8–12 cells per region per root from ≥ 10 roots per treatment. Error bars represent ± 1 SE; a.u., arbitrary units. ND, no statistical differences; *, P ≤ 0.05; **, P ≤ 0.01; ***, P ≤ 0.0001, one‐way ANOVA, compared with Dunnett's Method, comparing doses to control in each Region, in JMP. Results are from one representative experiment of three similar experiments with similar results. All IAA experiments were performed and analyzed double blind.
Figure 4
Figure 4
Short‐term auxin treatments cause actin filament unbundling. Representative images of individual filament bundling, unbundling, and annealing in Arabidopsis thaliana root Region 2 cells (a, b) and Region 3 cells (c, d); control (a, c) vs 10 nM indole‐3‐acetic acid (IAA) (b, d). Bars, 2 μm. (a, b) Timelapse series of variable angle epifluorescence microscopy (VAEM) images show that 10 nM IAA (b) increased actin filament unbundling in Region 2 within 7 min compared with control (a). Note that one unbundling event (filament unbundling shown as blue and green dots separating) occurred in (a), whereas three occurred in the same timespan in (b). There also was a small but statistically significant decrease in annealing events (white arrowheads) after IAA treatment. Other aspects of individual filament behaviors did not significantly change after treatment; for complete quantification of all measured individual filament dynamics, see Table 2. (c, d) Treatment with 10 nM IAA (d) increased actin filament unbundling and filament end annealing in Region 3 within 7 min compared with control (c). As in Region 2, IAA stimulated unbundling of actin filaments: two unbundling events are shown in (d) compared with only one event in (c). IAA also stimulated an increase in annealing in Region 3, where three annealing events are shown by white arrowheads (d). Bundling events are shown by either purple and magenta dots coming together (zippering of two independent filaments) or a series of magenta dots increasing in size (fluorescence intensity increase with no visible filament zippering). 100‐s timelapse movies were collected from short and long cells in the same 28 6‐d‐old, light‐grown roots. All auxin experiments were performed and analyzed double blind.
Figure 5
Figure 5
Actin organization in aux1‐100 fails to respond to short‐term indole‐3‐acetic acid (IAA) treatments but responds partially to the membrane‐permeable auxin 1‐naphthylacetic acid (NAA). (a–c) Representative VAEM images of green fluorescent protein fused to the second actin‐binding domain of Arabidopsis FIMBRIN1 (GFP‐fABD2)–labeled actin in Arabidopsis thaliana epidermal cells from wild‐type (ecotype Wassilewskija, WS) and aux1100, treated for 20–30 min with control (a), 10 nM IAA (b), or 100 nM NAA (c). Bar, 5 μm. (d–g) Quantification of actin organization in root epidermal cells. Wild‐type response is shown in blue and aux1‐100 in green; control, solid; 10 nM IAA, dots; 100 nM NAA, stripes. IAA failed to trigger an increase in actin filament density in aux1100 (d) but actin density in aux1‐100 increased in response to NAA. Skewness in both genotypes did not significantly respond to either treatment (e). After IAA and NAA treatments, actin arrays in WS plants were more ‘organized,’ with lower average filament angle (f) relative to the longitudinal axis of the cell and filaments generally more parallel to each other (g). Average actin filament angle and parallelness in aux1100 failed to reorganize in response to either IAA (dots) or the membrane‐permeable auxin NAA (stripes). n = 7–32 cells per root; 9–11 roots per genotype per treatment. Error bars represent ± 1 SE; a.u., arbitrary units. Different letters indicate statistically significant differences, oneway ANOVA, compared with Tukey–Kramer honest significant difference in JMP. Actin measurements were quantified on a per‐cell basis; see the Materials and Methods section for description and Supporting Information Fig. S7 for scatter plots. Results are from one representative experiment of two similar experiments with similar results. All auxin experiments were performed and analyzed double blind.
Figure 6
Figure 6
Hypothetical model of auxin perception by AUXIN RESISTANT 1 (AUX1) upstream of actin cytoskeleton reorganization. (a) Control conditions: unidentified actin binding proteins (ABP) ‐X and ‐Y are active and maintain actin array; an unidentified intermediary that differs between Col‐0 and WS is inactive. (b) Auxin is transported into a cell by AUX1, activating the unknown intermediary, inactivating both ABP‐X and ABP‐Y, and inducing increased actin filament abundance, decreased filament angle, and increased parallelness. (c) In the absence of AUX1, large quantities of indole‐3‐acetic acid (IAA) cannot enter cells. The membrane permeable auxin 1‐naphthylacetic acid (NAA) enters a cell, possibly activating the unknown intermediary; ABP‐X and ABP‐Y are differentially regulated and only either an increase in actin abundance or decrease in filament angle occurs.

References

    1. Andrianantoandro E, Blanchoin L, Sept D, McCammon JA, Pollard TD. 2001. Kinetic mechanism of end‐to‐end annealing of actin filaments. Journal of Molecular Biology 312: 721–730. - PubMed
    1. Baluška F, Jasik J, Edelmann HG, Salajová T, Volkmann D. 2001. Latrunculin B‐induced plant dwarfism: plant cell elongation is F‐actin‐dependent. Developmental Biology 231: 113–124. - PubMed
    1. Baluška F, Mancuso S. 2013. Root apex transition zone as oscillatory zone. Frontiers in Plant Science 4: e354. - PMC - PubMed
    1. Baluška F, Vitha S, Barlow PW, Volkmann D. 1997. Rearrangements of F‐actin arrays in growing cells of intact maize root apex tissues: a major developmental switch occurs in the postmitotic transition region. European Journal of Cell Biology 72: 113–121. - PubMed
    1. Band LR, Wells DM, Fozard JA, Ghetiu T, French AP, Pound MP, Wilson MH, Yu L, Li W, Hijazi HI et al 2014. Systems analysis of auxin transport in the Arabidopsis root apex. Plant Cell 26: 862–875. - PMC - PubMed

Publication types

LinkOut - more resources