. 2020 Apr 15;41(6):1644-1666.
doi: 10.1002/hbm.24901. Epub 2019 Dec 20.

Current intensity- and polarity-specific online and aftereffects of transcranial direct current stimulation: An fMRI study

Affiliations

Current intensity- and polarity-specific online and aftereffects of transcranial direct current stimulation: An fMRI study

Asif Jamil et al. Hum Brain Mapp. .

Abstract

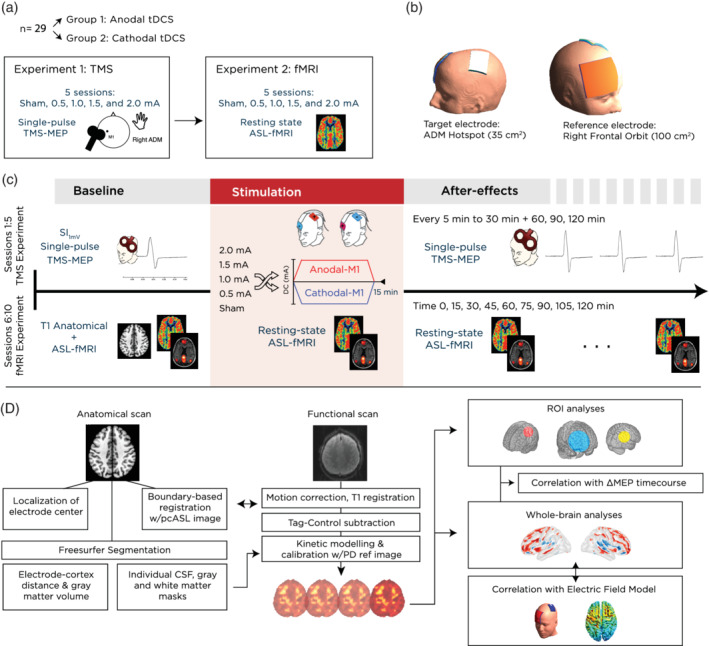
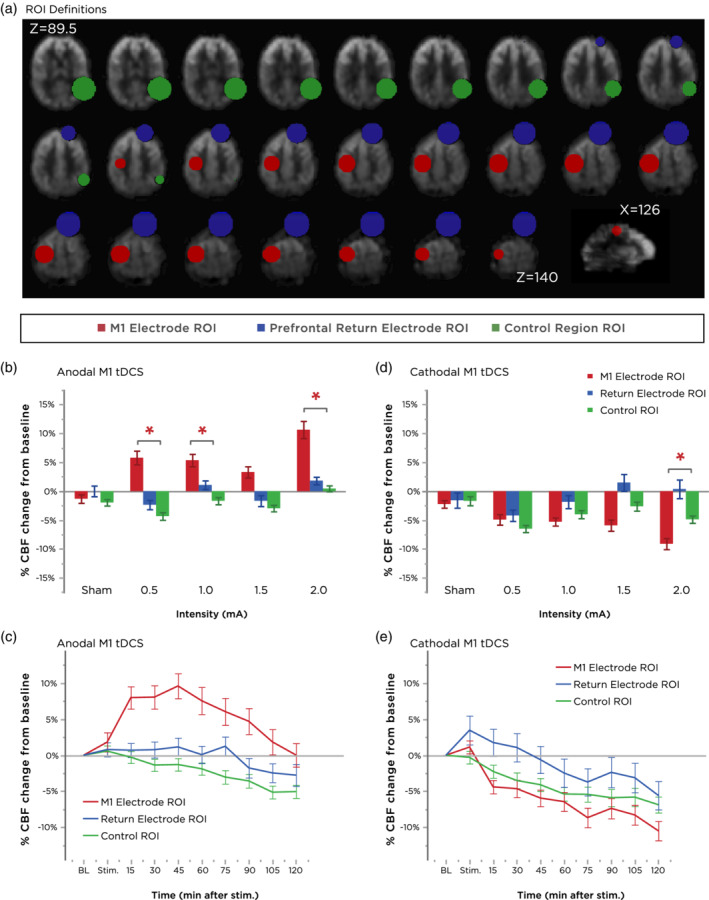
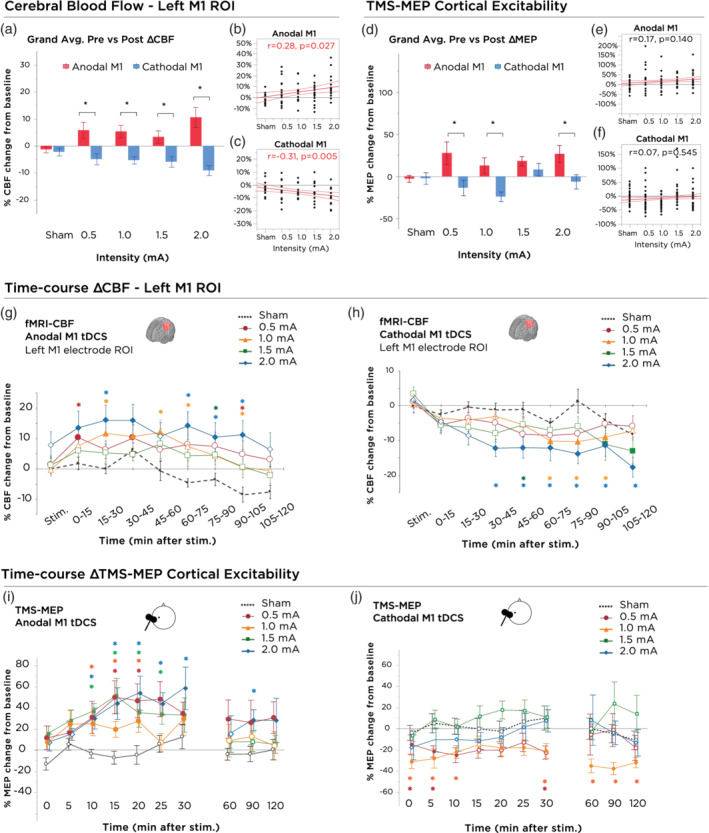
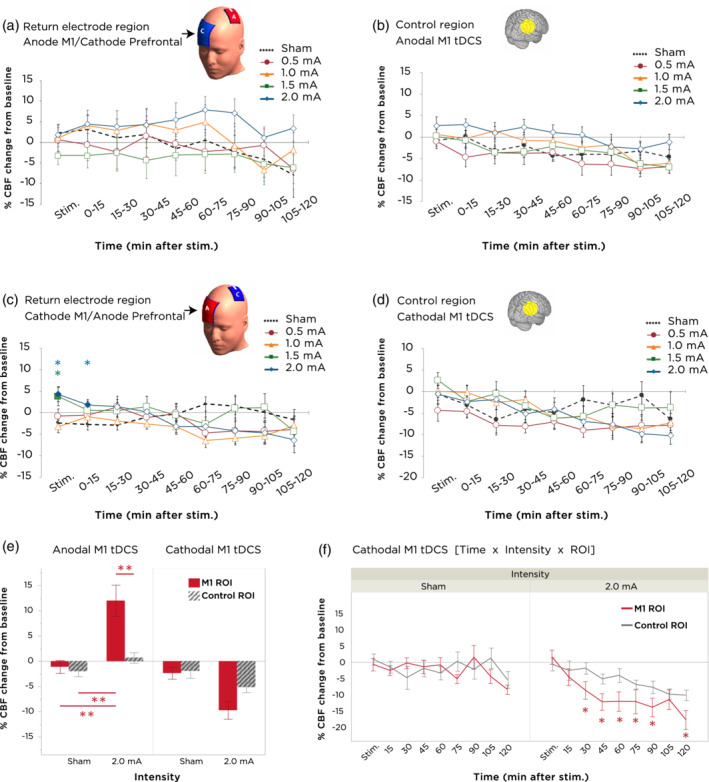
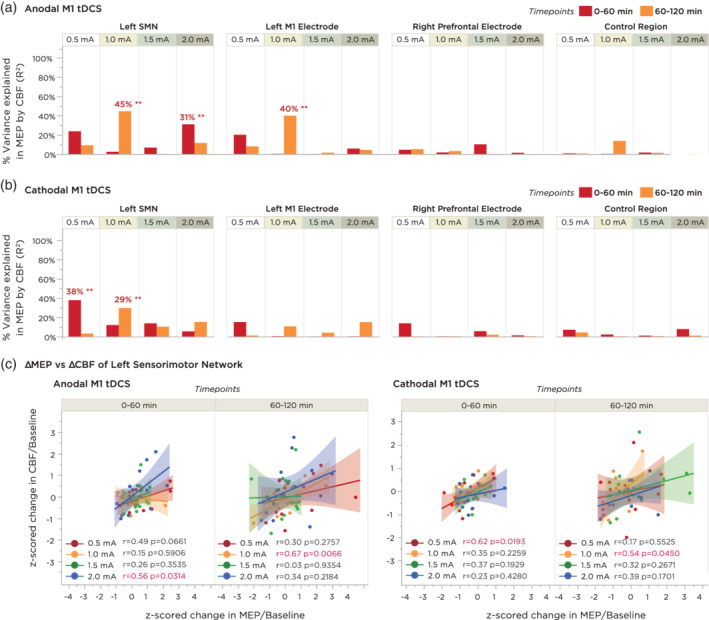
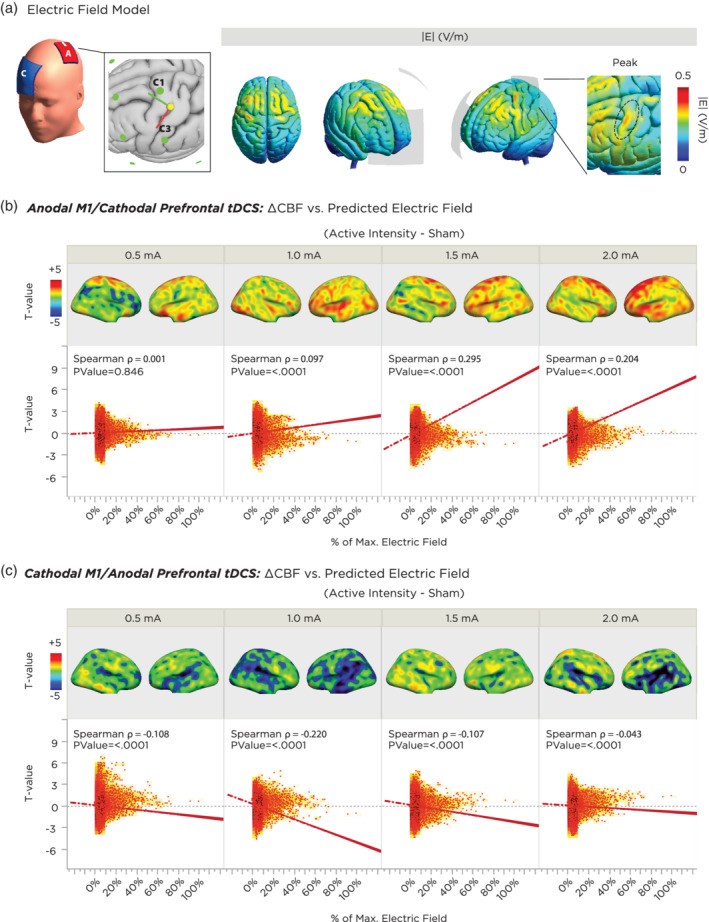
Transcranial direct current stimulation (tDCS) induces polarity- and dose-dependent neuroplastic aftereffects on cortical excitability and cortical activity, as demonstrated by transcranial magnetic stimulation (TMS) and functional imaging (fMRI) studies. However, lacking systematic comparative studies between stimulation-induced changes in cortical excitability obtained from TMS, and cortical neurovascular activity obtained from fMRI, prevent the extrapolation of respective physiological and mechanistic bases. We investigated polarity- and intensity-dependent effects of tDCS on cerebral blood flow (CBF) using resting-state arterial spin labeling (ASL-MRI), and compared the respective changes to TMS-induced cortical excitability (amplitudes of motor evoked potentials, MEP) in separate sessions within the same subjects (n = 29). Fifteen minutes of sham, 0.5, 1.0, 1.5, and 2.0-mA anodal or cathodal tDCS was applied over the left primary motor cortex (M1) in a randomized repeated-measure design. Time-course changes were measured before, during and intermittently up to 120-min after stimulation. ROI analyses indicated linear intensity- and polarity-dependent tDCS after-effects: all anodal-M1 intensities increased CBF under the M1 electrode, with 2.0-mA increasing CBF the greatest (15.3%) compared to sham, while all cathodal-M1 intensities decreased left M1 CBF from baseline, with 2.0-mA decreasing the greatest (-9.3%) from sham after 120-min. The spatial distribution of perfusion changes correlated with the predicted electric field, as simulated with finite element modeling. Moreover, tDCS-induced excitability changes correlated more strongly with perfusion changes in the left sensorimotor region compared to the targeted hand-knob region. Our findings reveal lasting tDCS-induced alterations in cerebral perfusion, which are dose-dependent with tDCS parameters, but only partially account for excitability changes.

Keywords: arterial spin labeling; cerebral blood flow; current intensity; inter-individual variability; motor cortex; transcranial direct current stimulation.


Conflict of interest statement

M.A.N. is a member of the advisory board of Neuroelectrics.

Figures

Figure 1
Figure 1
Experimental design and methods. (a) The study involved 29 participants divided into two groups, who took part in two consecutive experiments: a TMS‐based cortical excitability study to investigate the effect of current intensity on cortical excitability, and an fMRI study to investigate identical stimulation parameters on cerebral blood flow and functional connectivity. (b) Prior to the scanning session, the motor‐cortical representation of the right abductor digiti minimi muscle (ADM) was located using single‐pulse TMS. The respective position on the scalp was used to place a 35 cm2 target electrode, rotated 45° to the midline, and with the cable exiting from the right posterior edge. A larger 100 cm2 return electrode was positioned over the contralateral right orbit, with the cable exiting from the participant's right hand side. (c) Scanning sessions started with acquisition of a high resolution, T1‐weighted FLASH anatomical scan, followed by the first block of two resting state scans, consisting of either BOLD (6 min) or ASL (5 min) acquisitions (note that the ordering was counter‐balanced across subjects). This block was repeated an additional nine times, beginning with the stimulation block, where tDCS was delivered for 15 min using either sham, 0.5, 1.0, 1.5, or 2.0 mA anodal or cathodal stimulation. Subsequent measurements took place every 15 min following the stimulation, for up to 120 min. (d) The analysis pipeline included a separate preparation of anatomical images for extraction of indivdual antomical parameters, such as gray matter volume and electrode cortex distance. Functional images were preprocessed and registered to the subject's high resolution anatomical image, and then to the MNI template before proceeding with statistical analysis. ASL, arterial spin labeling; blood‐oxygen‐level‐dependent; tDCS, transcranial direct current stimulation; TMS, transcranial magnetic stimulation
Figure 2
Figure 2
Regional modulation of cerebral blood flow (CBF). (a) Axial slices extracted from a representative subject's mean perfusion‐weighted functional scan are labeled with definitions of the ROI masks used in the main analysis. Error bars represent the SEM. (b,c) Summary of the effects of different anodal M1 tDCS intensities (grand‐averaged over all timepoints in (b) and over all intensities in (c)) on each ROI. Note the selective effect of all intensities on CBF modulation in the target electrode/left hand M1 hand knob ROI, which persisted for the entire scanning duration. Error bars represent the SEM. (d,e) Summary of the effects of different cathodal M1 tDCS intensities (grand‐averaged over all timepoints in (d) and over all intensities in (e)) on each ROI. With the exception of 0.5 mA, the greatest decrease in CBF was again observed in the target electrode ROI. Cathodal‐M1 tDCS over all intensities induced a decrease in perfusion in the left M1 region, but a slight increase in perfusion in the right prefrontal region (location of the anodal electrode). Error bars represent the SEM. ROI, regions of interest; tDCS, transcranial direct current stimulation
Figure 3
Figure 3
Stimulation intensity and polarity dependent effects of tDCS on motor cortex excitability and local cerebral blood flow. (a) 0–120 min grand‐averaged after‐effects of cerebral blood flow following 15 min of anodal and cathodal stimulation at intensities ranging from sham‐2.0 mA within the target electrode ROI (left M1 hand knob region). Asterisks indicate significant differences between polarities (unpaired t‐test, p < .05). Polarity‐dependent differences were significant for all active tDCS intensities. Error bars indicate the SEM. (b) Correlation between current intensity and grand‐average change in CBF following anodal‐M1 tDCS. Red lines indicate the 95% CI. (c) Correlation between current intensity and grand‐average change in CBF following cathodal‐M1 tDCS. Red lines indicate the 95% CI. (d) 0–120 min grand‐averaged after‐effects of cortical excitability following 15 min of anodal and cathodal stimulation at intensities ranging from sham‐2.0 mA on the mean MEP amplitude. Asterisks indicate significant differences between polarities (unpaired t‐test, p < .05). Polarity differences were significant with current intensities of 0.5, 1.0, and 2.0 mA. Error bars indicate the SEM. (e) Correlation between current intensity and grand‐average change in motor cortex excitability following anodal‐M1 tDCS. Red lines indicate the 95% CI. (f) Correlation between current intensity and grand‐average change in motor cortex excitability following cathodal‐M1 tDCS. Red lines indicate the 95% CI. (g) Time‐course changes of CBF within the left M1 hand knob ROI following anodal M1 tDCS. 2.0 mA resulted in significantly elevated CBF, compared to sham, which persisted over the majority of the 2 hr session and peaked between 30–45 min after tDCS. Error bars indicate the SEM. (h) Time‐course changes of CBF within the left M1 hand knob ROI following cathodal M1 tDCS. 2.0 mA resulted in significantly decreased CBF, compared to sham as well as baseline, which lasted the entire 2 hr session. Delayed onset after‐effects were observed for the 1.0 mA intensity, between timepoints 60–105 min. Other intensities, although not significant, led to trendwise identically directed effects. Error bars indicate the SEM. (i) Time‐course changes in cortical excitability following anodal‐M1 tDCS. Filled symbols indicate a significant difference in cortical excitability against the “0” baseline (one‐sample t‐test, two‐tailed, p < .05). Floating symbols indicate a significant difference between the active intensity and sham stimulation (paired t‐test, two‐tailed, p < .05). Anodal stimulation over all active intensities resulted in significant increases of excitability lasting up to 30 min. Sham stimulation did not induce any significant change in cortical excitability. Error bars indicate the SEM. (j) After‐effects of cortical excitability following 15 min of cathodal stimulation at intensities ranging from sham‐2.0 mA on the mean MEP amplitude. Filled symbols indicate a significant difference in cortical excitability against the “0” baseline (one‐sample t‐test, two‐tailed, p < .05). Floating asterisks indicate a significant difference between the active intensity and sham stimulation (paired t‐test, two‐tailed, p < .05). Only 0.5 and 1.0 mA cathodal stimulation resulted in significant differences from baseline, and only 1.0 mA was significantly different from sham through the later time bins. Higher intensities such as 1.5 and 2.0 mA tended to return to baseline values after about 10 min. Sham stimulation did not induce any significant change in cortical excitability. Error bars indicate the SEM. MEP, motor evoked potential; ROI, regions of interest; tDCS, transcranial direct current stimulation
Figure 4
Figure 4
Cerebral blood flow alterations at return electrode and control ROIs. (a) Time‐course changes of CBF within the return electrode ROI following anodal M1 tDCS. No significant differences between intensities or timepoints were obtained. Error bars indicate the SEM. (b) Time‐course changes of CBF within the control region ROI following anodal M1 tDCS. No significant intensity or timepoint differences were found. Error bars indicate the SEM. (c) Time‐course changes of CBF within the return electrode ROI following cathodal M1 tDCS. An increase in CBF compared to sham was observed with 1.5 mA and 2.0 mA during the stimulation block. Error bars indicate the SEM. (d) Time‐course changes of CBF within the control region ROI following cathodal M1 tDCS. No significant differences in stimulation intensity or timepoint were found. Error bars indicate the SEM. (e) Evaluation of the anatomical specificity of anodal‐ and cathodal‐M1 tDCS through an interaction analysis between (1) changes in CBF between sham tDCS and 2.0 mA tDCS with (2) changes in CBF between the target M1 ROI vs. the control ROI. For anodal‐M1 tDCS, a significant ROI × intensity interaction indicates greater increase in CBF with 2.0 mA at the target M1 site, but not in the control ROI, when compared to sham tDCS. Double asterisks indicate values of p < .001 (paired t‐tests), and error bars indicate the SEM. (f) For cathodal‐M1 tDCS, a time × intensity × ROI interaction is observed, which indicates decreased CBF in the target M1 region relative to the control ROI during the timepoints between 30–90 and 120 min after 2.0 mA tDCS. Asterisks indicate values of p < .05 (paired t‐tests), and error bars indicate the SEM. CBF, cerebral blood flow; ROI, regions of interest; tDCS, transcranial direct current stimulation
Figure 5
Figure 5
Correlation analyses between time‐binned averages in motor cortical excitability and cerebral blood flow. MEPs were compared to CBF values from four regions of interest: (I) the left sensorimotor network consisting of the somatosensory, primary and premotor cortices; (II) the anatomical region underneath the target electrode, corresponding to the left M1 hand knob area; (III) the anatomical region underneath the return electrode, corresponding to the right prefrontal area; and (IV) an ROI of the same size as the M1 ROI located over the right temporo‐occipital area. Correlations were calculated using linear/Pearson correlation between each subject's z‐normalized change in CBF versus their z‐normalized change in MEP, averaged across two 60‐min time bins. (a) Summary of percentage variance explained (R 2 value) for each of the above comparisons for anodal M1 tDCS. Double asterisks indicate a significant correlation (p < .05). (b) Summary of percentage variance explained for each of the above comparisons for cathodal M1 tDCS. Note that both anodal and cathodal M1 tDCS showed stronger associations between MEP and CBF changes within the Left SMN ROI. (c) Expanded plots of the correlation between change in CBF and MEP within the left SMN ROI for both anodal and cathodal M1 tDCS. Shaded background regions indicate the 95% CI. CBF, cerebral blood flow; MEP, motor evoked potential; ROI, regions of interest; tDCS, transcranial direct current stimulation
Figure 6
Figure 6
Correlation between a realistic finite element model of the predicted changes in the electric field of cortical gray matter and actual physiological findings from the experiment. (a) Location of target and return electrodes on the MNI template head. The return electrode was positioned over position the “AF4” EEG position, and the M1 electrode was placed according to MNI‐standardized coordinates of the hand knob region. The resulting montage was segmented using the finite‐element‐method across anatomical tissue layers, and the electric field was computed, which showed a maximum peak underneath, and along the anterior edge of the target electrode. (b) Correlation between predicted electric field strength and tDCS‐induced CBF changes as a function of current intensity for anodal‐M1 tDCS. The top panels summarize the grand‐average T‐contrast between the active tDCS intensity vs sham, and the bottom panels indicate the respective voxel‐wise correlations between functional activation and predicted electric field. All intensities show a positive correlation (i.e., higher electric field predicted greater CBF increase relative to sham). Note that higher intensities of 1.5 and 2.0 mA showed a stronger association. (c) Correlation between predicted electric field strength and tDCS‐induced CBF changes as a function of current intensity for cathodal‐M1 tDCS. All intensities show a negative correlation (i.e., higher electric field predicted greater CBF decrease relative to sham). Note that the 1.0 mA intensity showed the strongest association. CBF, cerebral blood flow; tDCS, transcranial direct current stimulation

Similar articles

Cited by

References

    1. Alsop, D. C. , Detre, J. A. , Golay, X. , Günther, M. , Hendrikse, J. , Hernandez‐Garcia, L. , … Zaharchuk, G. (2015). Recommended implementation of arterial spin‐labeled perfusion MRI for clinical applications: A consensus of the ISMRM perfusion study group and the European consortium for ASL in dementia. Magnetic Resonance in Medicine, 73, 102–116. - PMC - PubMed
    1. Ambrus, G. G. , Al‐Moyed, H. , Chaieb, L. , Sarp, L. , Antal, A. , & Paulus, W. (2012). The fade‐in—short stimulation—fade out approach to sham tDCS—reliable at 1 mA for naïve and experienced subjects, but not investigators. Brain Stimulation, 5, 499–504. - PubMed
    1. Antal, A. , Bikson, M. , Datta, A. , Lafon, B. , Dechent, P. , Parra, L. C. , & Paulus, W. (2014). Imaging artifacts induced by electrical stimulation during conventional fMRI of the brain. NeuroImage, 85, 1040–1047. - PMC - PubMed
    1. Antal, A. , Terney, D. , Poreisz, C. , & Paulus, W. (2007). Towards unravelling task‐related modulations of neuroplastic changes induced in the human motor cortex. The European Journal of Neuroscience, 26, 2687–2691. - PubMed
    1. Attwell, D. , Buchan, A. M. , Charpak, S. , Lauritzen, M. , Macvicar, B. A. , & Newman, E. A. (2010). Glial and neuronal control of brain blood flow. Nature, 468, 232–243. - PMC - PubMed

Publication types

MeSH terms