. 2019 Dec 20;15(12):e1007979.
doi: 10.1371/journal.pgen.1007979. eCollection 2019 Dec.

Crossover interference and sex-specific genetic maps shape identical by descent sharing in close relatives

Affiliations

Crossover interference and sex-specific genetic maps shape identical by descent sharing in close relatives

Madison Caballero et al. PLoS Genet. .

Abstract

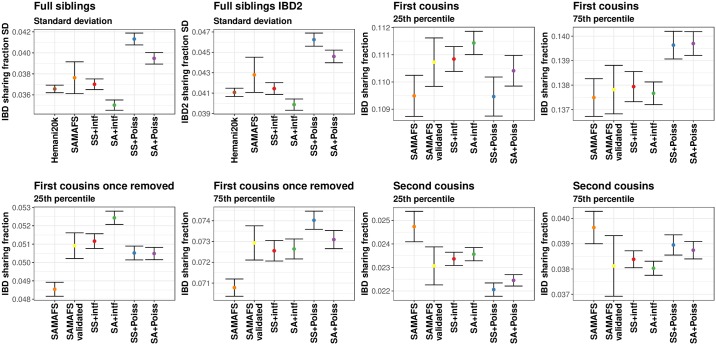
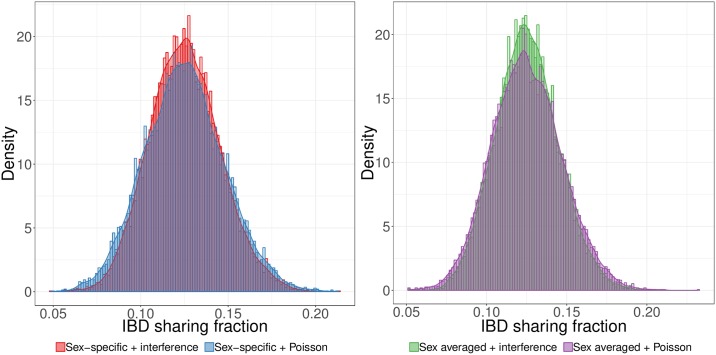
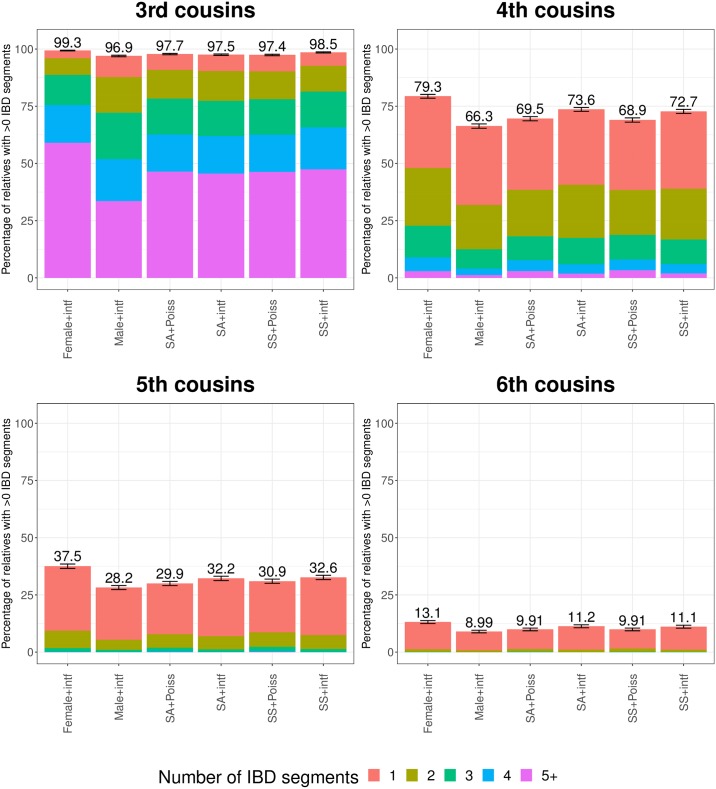
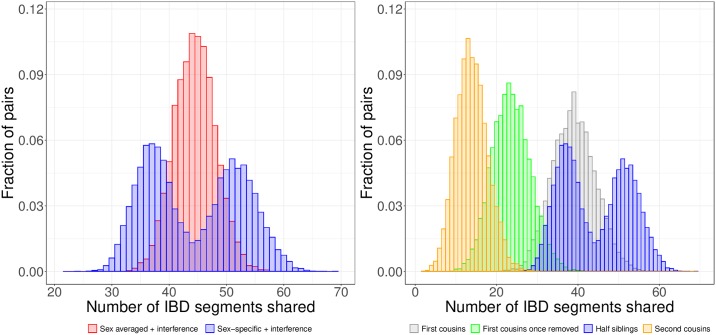
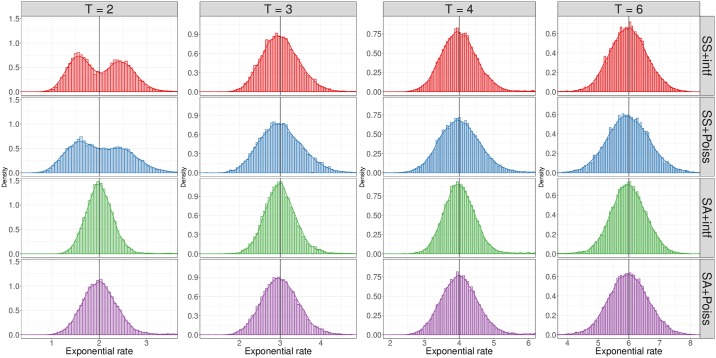
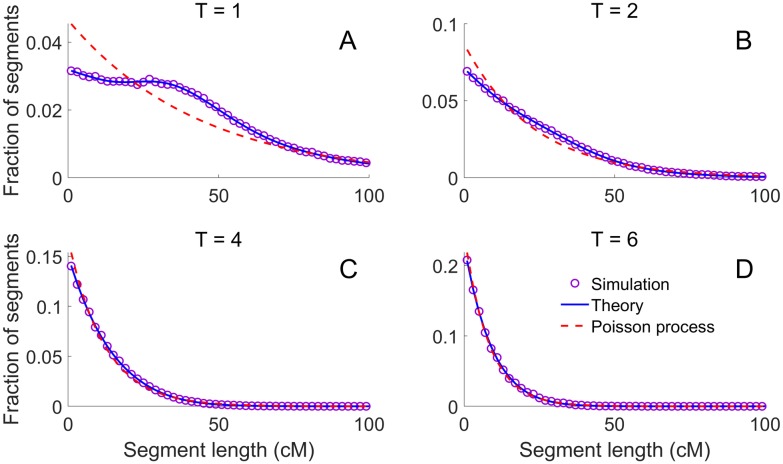
Simulations of close relatives and identical by descent (IBD) segments are common in genetic studies, yet most past efforts have utilized sex averaged genetic maps and ignored crossover interference, thus omitting features known to affect the breakpoints of IBD segments. We developed Ped-sim, a method for simulating relatives that can utilize either sex-specific or sex averaged genetic maps and also either a model of crossover interference or the traditional Poisson model for inter-crossover distances. To characterize the impact of previously ignored mechanisms, we simulated data for all four combinations of these factors. We found that modeling crossover interference decreases the standard deviation of pairwise IBD proportions by 10.4% on average in full siblings through second cousins. By contrast, sex-specific maps increase this standard deviation by 4.2% on average, and also impact the number of segments relatives share. Most notably, using sex-specific maps, the number of segments half-siblings share is bimodal; and when combined with interference modeling, the probability that sixth cousins have non-zero IBD sharing ranges from 9.0 to 13.1%, depending on the sexes of the individuals through which they are related. We present new analytical results for the distributions of IBD segments under these models and show they match results from simulations. Finally, we compared IBD sharing rates between simulated and real relatives and find that the combination of sex-specific maps and interference modeling most accurately captures IBD rates in real data. Ped-sim is open source and available from https://github.com/williamslab/ped-sim.


Conflict of interest statement

Shai Carmi is a paid consultant for MyHeritage. All other authors declare no competing interests exist.

Figures

Fig 1
Fig 1. IBD sharing fraction standard deviations in full siblings and 25th and 75th percentiles in first through second cousins from real and simulated data.
Points are from the SAMAFS, SAMAFS-validated subset (except full siblings), Hemani20k set (only full siblings), and the simulation models. The latter are labeled using abbreviations given in the main text. The SAMAFS and SAMAFS-validated 25th and 75th percentiles are from values mean-shifted to match expectations. Bars indicate 95% confidence interval (±1.96 standard errors) as calculated from 1,000 bootstrap samples. Standard deviations for first through second cousins and 25th and 75th percentiles for full siblings are in S2 Fig, and further statistics are in S3 Fig. SD indicates standard deviation.
Fig 2
Fig 2. First cousins simulated with crossover interference have a distribution of IBD sharing proportion more concentrated near the mean than those simulated using a Poisson model.
Interference decreases the variance in IBD sharing both when using sex-specific (left) and sex averaged (right) genetic maps.
Fig 3
Fig 3. Number of IBD segments that simulated third through sixth cousins share under various modeling scenarios.
More distant relatives have reduced rates of sharing one or more IBD regions. Percentages above each bar indicate the fraction of simulated relatives (of 10,000 for each scenario) that have at least one segment shared. Female+intf are from simulations using sex-specific maps and interference but where the pairs are related through only female non-founders, with a male and female couple as founder common ancestors (S8B Fig). Male+intf pairs are the same as Female+intf but with the non-founders being only male instead of female. Error bars are the 95% confidence interval (±1.96 standard errors) of the percentage of relatives that share at least one IBD segment based on 1,000 bootstrap samples. Error on internal bar segment counts are in S10 Fig.
Fig 4
Fig 4. Sex-specific maps impact the number of segments half-siblings share.
Number of IBD segments half-siblings share when simulated with sex averaged maps compared to sex-specific maps have very different shapes, with sex-specific maps producing a bimodal distribution (left). Half-sibling segment counts in the context of other relative types where we simulated all relatives under sex-specific maps (right). The lower mode of half-sibling segment counts—which corresponds to IBD sharing between paternal half-siblings (S11A Fig)—is below that of first cousins. The distributions are based on 10,000 pairs simulated under interference for all relationship types.
Fig 5
Fig 5. Distributions of estimated time since admixture based on one admixed sample.
Histograms show estimated rates from 15,000 individuals simulated under each crossover model. Estimates are rate fits of an exponential distribution accounting for finite chromosomes (Methods). Horizontal lines indicate the true T.
Fig 6
Fig 6. The effect of crossover interference on IBD segment lengths.
We used Ped-sim to simulate half-cousins with a common ancestor T = 1, 2, 4, 6 generations ago (panels A-D, respectively) under the SA+intf model, extracting IBD segment lengths for chromosome 1. Each panel shows the simulated distribution of IBD segment lengths (over 105 pairs for T = 1, 2 and 106 pairs otherwise; purple circles), the theory from Eq (1) (blue lines; including the finite-chromosome correction of Eq (16)), and the expectation based on a Poisson process (red dashed lines; Eq (17)).

References

    1. Weir BS, Anderson AD, Hepler AB. Genetic relatedness analysis: modern data and new challenges. Nature Reviews Genetics. 2006;7(10):771–780. 10.1038/nrg1960 - DOI - PubMed
    1. Bycroft C, Freeman C, Petkova D, Band G, Elliott LT, Sharp K, et al. The UK Biobank resource with deep phenotyping and genomic data. Nature. 2018;562(7726):203–209. 10.1038/s41586-018-0579-z - DOI - PMC - PubMed
    1. Staples J, Maxwell EK, Gosalia N, Gonzaga-Jauregui C, Snyder C, Hawes A, et al. Profiling and Leveraging Relatedness in a Precision Medicine Cohort of 92,455 Exomes. The American Journal of Human Genetics. 2018;102(5):874–889. 10.1016/j.ajhg.2018.03.012 - DOI - PMC - PubMed
    1. Staples J, Witherspoon DJ, Jorde LB, Nickerson DA, Below JE, Huff CD, et al. PADRE: Pedigree-Aware Distant-Relationship Estimation. The American Journal of Human Genetics. 2016;99(1):154–162. 10.1016/j.ajhg.2016.05.020 - DOI - PMC - PubMed
    1. Ko A, Nielsen R. Composite likelihood method for inferring local pedigrees. PLOS Genetics. 2017;13(8):e1006963 10.1371/journal.pgen.1006963 - DOI - PMC - PubMed

Publication types