. 2019 Dec 17;9(12):383.
doi: 10.3390/brainsci9120383.

Neurologic Injury and Brain Growth in the Setting of Long-Gap Esophageal Atresia Perioperative Critical Care: A Pilot Study

Affiliations

Neurologic Injury and Brain Growth in the Setting of Long-Gap Esophageal Atresia Perioperative Critical Care: A Pilot Study

Samuel S Rudisill et al. Brain Sci. .

Abstract

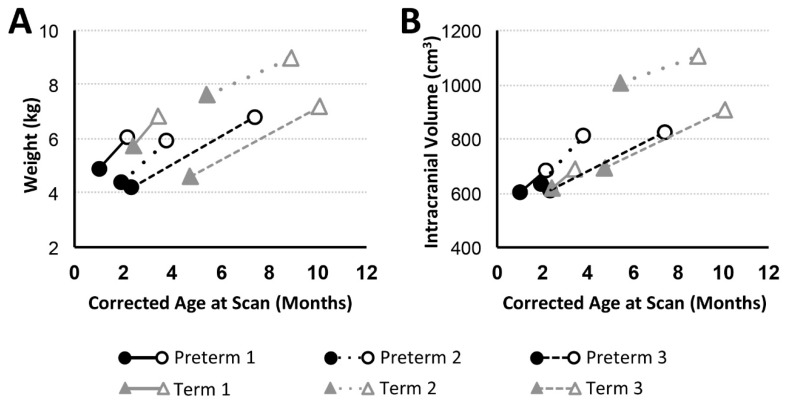
We previously showed that infants born with long-gap esophageal atresia (LGEA) demonstrate clinically significant brain MRI findings following repair with the Foker process. The current pilot study sought to identify any pre-existing (PRE-Foker process) signs of brain injury and to characterize brain and corpus callosum (CC) growth. Preterm and full-term infants (n = 3/group) underwent non-sedated brain MRI twice: before (PRE-Foker scan) and after (POST-Foker scan) completion of perioperative care. A neuroradiologist reported on qualitative brain findings. The research team quantified intracranial space, brain, cerebrospinal fluid (CSF), and CC volumes. We report novel qualitative brain findings in preterm and full-term infants born with LGEA before undergoing Foker process. Patients had a unique hospital course, as assessed by secondary clinical end-point measures. Despite increased total body weight and absolute intracranial and brain volumes (cm3) between scans, normalized brain volume was decreased in 5/6 patients, implying delayed brain growth. This was accompanied by both an absolute and relative CSF volume increase. In addition to qualitative findings of CC abnormalities in 3/6 infants, normative CC size (% brain volume) was consistently smaller in all infants, suggesting delayed or abnormal CC maturation. A future larger study group is warranted to determine the impact on the neurodevelopmental outcomes of infants born with LGEA.

Keywords: LGEA; MRI; infant; midazolam; morphine; neuroimaging; opioids; term; tolerance; weaning.


Conflict of interest statement

The authors declare no conflicts of interest. The funders had no role in the design of the study; in the collection, analyses, or interpretation of data; in the writing of the manuscript; or in the decision to publish the results.

Figures

Figure 1
Figure 1
Pharmacological course (graphs) and corresponding representative brain MRI cross-sections (right panels). Graphs illustrate the timing and duration of various pharmacological treatments for preterm (n = 3) and full-term (n = 3) patients between PRE- and POST-Foker brain MRI scans (vertical dashed lines). The POST-Foker process brain MRI scan for Preterm 2 was obtained before completion of sedation weaning due to transfer to another hospital. Representative T2-weighted images in axial view (at the level of the body of the lateral ventricles) illustrate brain parenchyma and segmentation masks for divisions of CSF: extra-axial space (blue) and ventricles (yellow). Qualitative evaluation of the PRE-Foker process brain MRI scans showed increased CSF volumes in extra-axial space (white arrows) and/or ventricles (black arrows) for all except Preterm 1. Furthermore, POST-Foker process scans showed a mild increase in CSF in either or both CSF compartments (*) for all subjects, including a case of novel subdural hematoma (Preterm 1, POST-Foker scan; obscured by the blue mask; see also Figure 2 in [17]).
Figure 2
Figure 2
Body Weight and Intracranial Volume with Advancing Age. Graphs show body weight (kg; (A)) and intracranial volume (cm3; (B)) trajectories for preterm (n = 3; black circles) and full-term (n = 3; gray triangles) patients between PRE- (filled marker) and POST- (open marker) Foker process brain MRI scans. Both preterm and full-term infants show an increase in weight and intracranial volume (an indirect marker of head circumference) between the two MRI scans.
Figure 3
Figure 3
Brain and Total cerebrospinal fluid (CSF) Volume with Advancing Age. Graphs display absolute and normalized brain (A,B) and total CSF (C,D) volume trajectories for preterm (n = 3; black circles) and full-term (n = 3; gray triangles) patients between PRE- (filled marker) and POST- (open marker) Foker process brain MRI scans. Despite brain growth in 5/6 infants (A; similar results found for T1-weighted analysis), this growth was not proportional to intracranial volume (ICV; Figure 2B), resulting in decreased normalized brain volumes (B). Reciprocal changes are reported for total absolute (C) and normalized CSF (D) volumes.
Figure 4
Figure 4
Volumes of CSF Compartments with Advancing Age. Graphs display absolute and normalized extra-axial space (A,B) and ventricular (C,D) volume trajectories for preterm (n = 3; black circles) and full-term (n = 3; gray triangles) patients between PRE- (filled marker) and POST- (open marker) Foker process brain MRI scans. Based on T2-weighted analysis, all patients (except Term 3) showed increase in absolute extra-axial space (A) and ventricular (C) volumes, similar to the pattern observed for absolute total CSF (Figure 3C). Normalized volumes as % total CSF volume) are shown in Panels (B,D).
Figure 5
Figure 5
Total Brain Volume and Corpus Callosum with Age. Panel A shows 3-D renderings of total brain (red) and corpus callosum (CC; yellow) structural masks based on T1-weighted brain MRI segmentation. Graphs illustrate volumetric data for preterm (n = 3; black circles) and full-term (n = 3; gray triangles) patients at PRE- (filled marker) and POST- (open marker) Foker brain MRI. Panels (B) and (C) show absolute brain and CC volume (cm3), respectively. Normalized volume of CC (as %brain volume) is shown in Panel (D).

References

    1. Vohr B. Long-term outcomes of moderately preterm, late preterm, and early term infants. Clin. Perinatol. 2013;40:739–751. doi: 10.1016/j.clp.2013.07.006. - DOI - PubMed
    1. Doyle L.W., Anderson P.J. Adult outcome of extremely preterm infants. Pediatrics. 2010;126:342–351. doi: 10.1542/peds.2010-0710. - DOI - PubMed
    1. Grunau R.E., Holsti L., Peters J.W. Long-term consequences of pain in human neonates. Semin. Fetal Neonatal Med. 2006;11:268–275. doi: 10.1016/j.siny.2006.02.007. - DOI - PubMed
    1. Rice D., Barone S., Jr. Critical periods of vulnerability for the developing nervous system: Evidence from humans and animal models. Environ. Health Perspect. 2000;108(Suppl. 3):511–533. doi: 10.1289/ehp.00108s3511. - DOI - PMC - PubMed
    1. Haynes R.L., Sleeper L.A., Volpe J.J., Kinney H.C. Neuropathologic studies of the encephalopathy of prematurity in the late preterm infant. Clin. Perinatol. 2013;40:707–722. doi: 10.1016/j.clp.2013.07.003. - DOI - PubMed

LinkOut - more resources