

Identification of Astrocytoma Blood Serum Protein Profile
- PMID: 31861636
- PMCID: PMC7017117
- DOI: 10.3390/cells9010016
Identification of Astrocytoma Blood Serum Protein Profile
Abstract
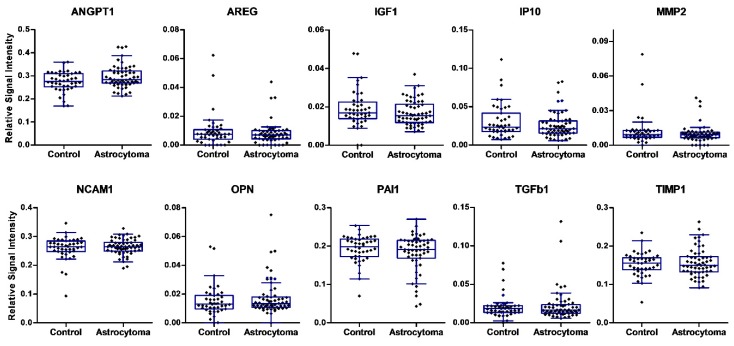
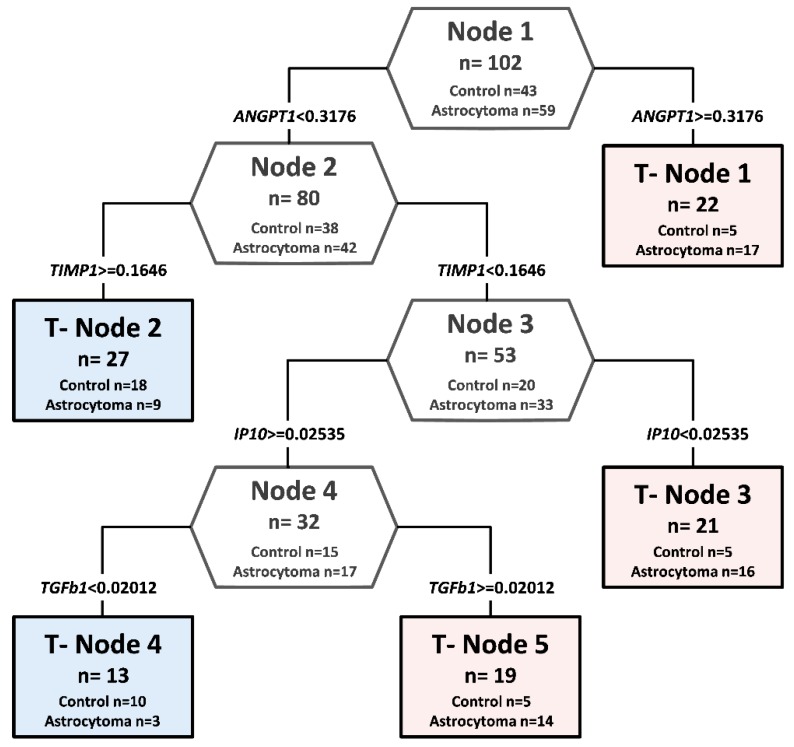
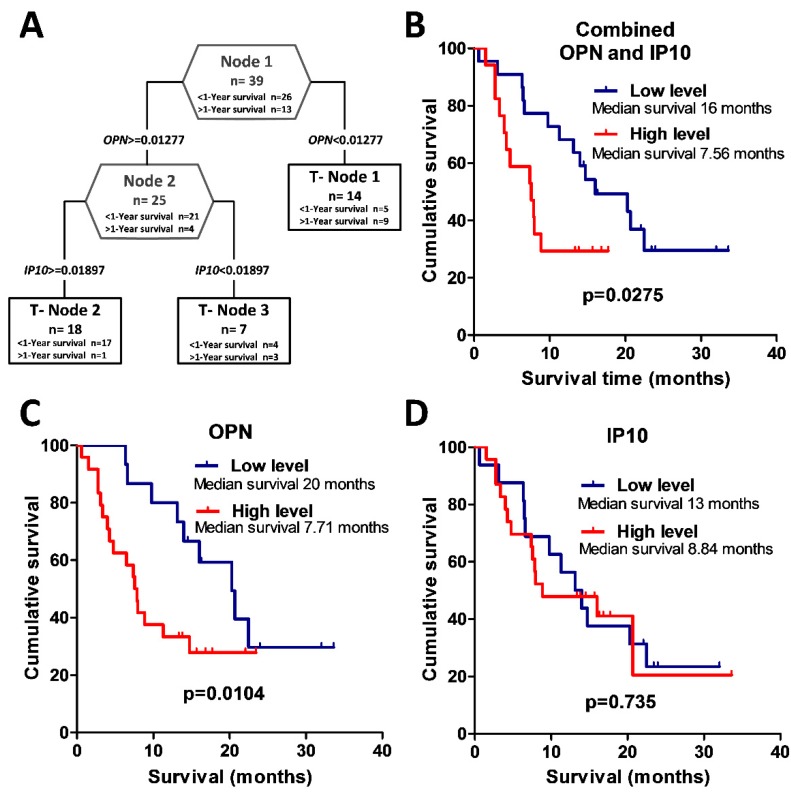
High-grade astrocytomas are some of the most common and aggressive brain cancers, whose signs and symptoms are initially non-specific. Up to the present date, there are no diagnostic tools to observe the early onset of the disease. Here, we analyzed the combination of blood serum proteins, which may play key roles in the tumorigenesis and the progression of glial tumors. Fifty-nine astrocytoma patients and 43 control serums were analyzed using Custom Human Protein Antibody Arrays, including ten targets: ANGPT1, AREG, IGF1, IP10, MMP2, NCAM1, OPN, PAI1, TGFβ1, and TIMP1. The decision tree analysis indicates that serums ANGPT1, TIMP1, IP10, and TGFβ1 are promising combinations of targets for glioma diagnostic applications. The accuracy of the decision tree algorithm was 73.5% (75/102), which correctly classified 79.7% (47/59) astrocytomas and 65.1% (28/43) healthy controls. The analysis revealed that the relative value of osteopontin (OPN) protein level alone predicted the 12-month survival of glioblastoma (GBM) patients with the specificity of 84%, while the inclusion of the IP10 protein increased model predictability to 92.3%. In conclusion, the serum protein profiles of ANGPT1, TIMP1, IP10, and TGFβ1 were associated with the presence of astrocytoma independent of its malignancy grade, while OPN and IP10 were associated with GBM patient survival.
Keywords: Protein Antibody Array; astrocytoma; decision tree; glioblastoma; serum proteins; survival.
Conflict of interest statement
The authors declare no conflict of interest.
Figures
Similar articles
-
Serum protein triplet TGF-β1, TIMP-1, and YKL-40 serve as diagnostic and prognostic profile for astrocytoma.Sci Rep. 2021 Jun 23;11(1):13100. doi: 10.1038/s41598-021-92328-3. Sci Rep. 2021. PMID: 34162919 Free PMC article.
-
Identification of potential serum biomarkers of glioblastoma: serum osteopontin levels correlate with poor prognosis.Cancer Epidemiol Biomarkers Prev. 2010 Jun;19(6):1409-22. doi: 10.1158/1055-9965.EPI-09-1077. Cancer Epidemiol Biomarkers Prev. 2010. PMID: 20530493
-
Manganese superoxide dismutase (MnSOD) is a malignant astrocytoma specific biomarker and associated with adverse prognosis in p53 expressing glioblastoma.Pathol Res Pract. 2016 Jan;212(1):17-23. doi: 10.1016/j.prp.2015.11.002. Epub 2015 Nov 14. Pathol Res Pract. 2016. PMID: 26616112
-
Low grade astrocytomas: controversies in management.J Clin Neurosci. 2000 Nov;7(6):475-83. doi: 10.1054/jocn.2000.0774. J Clin Neurosci. 2000. PMID: 11029226 Review.
-
[Grading of astrocytomas and oligodendrogliomas].Pathologe. 1998 Jul;19(4):259-68. doi: 10.1007/s002920050282. Pathologe. 1998. PMID: 9746910 Review. German.
Cited by
-
Prognostic and Predictive Biomarkers in Gliomas.Int J Mol Sci. 2021 Sep 26;22(19):10373. doi: 10.3390/ijms221910373. Int J Mol Sci. 2021. PMID: 34638714 Free PMC article. Review.
-
Molecular and Cellular Mechanisms of Glioblastoma.Cells. 2021 Jun 10;10(6):1456. doi: 10.3390/cells10061456. Cells. 2021. PMID: 34200693 Free PMC article.
-
Serum protein triplet TGF-β1, TIMP-1, and YKL-40 serve as diagnostic and prognostic profile for astrocytoma.Sci Rep. 2021 Jun 23;11(1):13100. doi: 10.1038/s41598-021-92328-3. Sci Rep. 2021. PMID: 34162919 Free PMC article.
-
Comprehensive analysis of expression, prognosis and immune infiltration for TIMPs in glioblastoma.BMC Neurol. 2021 Nov 15;21(1):447. doi: 10.1186/s12883-021-02477-1. BMC Neurol. 2021. PMID: 34781885 Free PMC article.
-
The Anticancer Potential of Maslinic Acid and Its Derivatives: A Review.Drug Des Devel Ther. 2021 Sep 9;15:3863-3879. doi: 10.2147/DDDT.S326328. eCollection 2021. Drug Des Devel Ther. 2021. PMID: 34526766 Free PMC article. Review.
References
-
- Elstner A., Stockhammer F., Nguyen-Dobinsky T.N., Nguyen Q.L., Pilgermann I., Gill A., Guhr A., Zhang T., Von Eckardstein K., Picht T., et al. Identification of diagnostic serum protein profiles of glioblastoma patients. J. Neurooncol. 2011;102:71–80. doi: 10.1007/s11060-010-0284-8. - DOI - PMC - PubMed
-
- Boots-Sprenger S.H.E., Sijben A., Rijntjes J., Tops B.B.J., Idema A.J., Rivera A.L., Bleeker F.E., Gijtenbeek A.M., Diefes K., Heathcock L., et al. Significance of complete 1p/19q co-deletion, IDH1 mutation and MGMT promoter methylation in gliomas: Use with caution. Mod. Pathol. 2013;26:922–929. doi: 10.1038/modpathol.2012.166. - DOI - PubMed
Publication types
MeSH terms
Substances
Grants and funding
LinkOut - more resources
Full Text Sources
Research Materials
Miscellaneous
