. 2019 Dec 19;12(1):22.
doi: 10.3390/cancers12010022.

Overexpression of Mitochondrial IF1 Prevents Metastatic Disease of Colorectal Cancer by Enhancing Anoikis and Tumor Infiltration of NK Cells

Affiliations

Overexpression of Mitochondrial IF1 Prevents Metastatic Disease of Colorectal Cancer by Enhancing Anoikis and Tumor Infiltration of NK Cells

Lucía González-Llorente et al. Cancers (Basel). .

Abstract

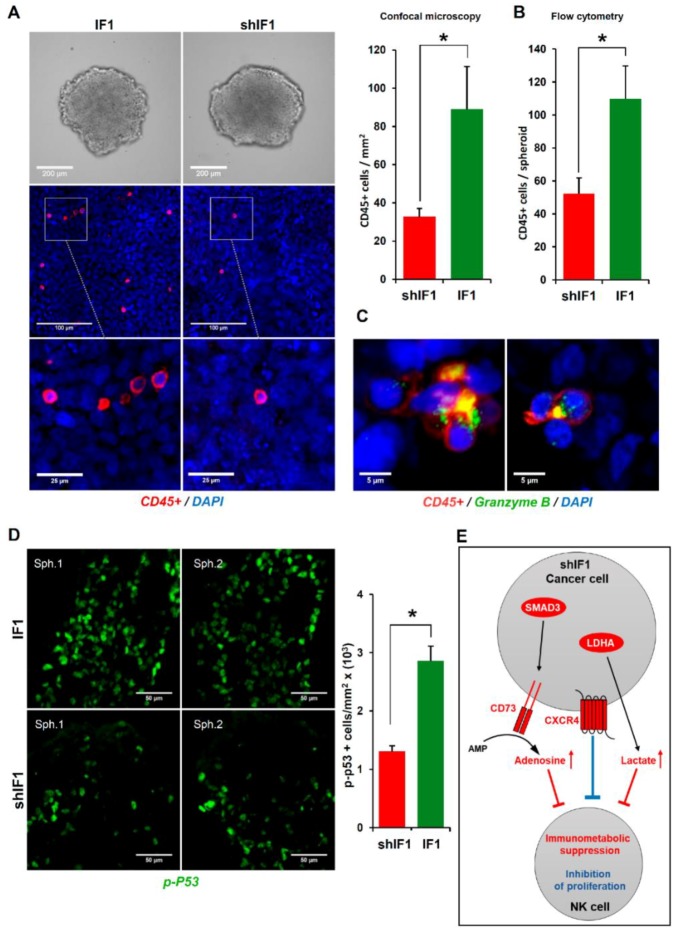
Increasing evidences show that the ATPase Inhibitory Factor 1 (IF1), the physiological inhibitor of the ATP synthase, is overexpressed in a large number of carcinomas contributing to metabolic reprogramming and cancer progression. Herein, we show that in contrast to the findings in other carcinomas, the overexpression of IF1 in a cohort of colorectal carcinomas (CRC) predicts less chances of disease recurrence, IF1 being an independent predictor of survival. Bioinformatic and gene expression analyses of the transcriptome of colon cancer cells with differential expression of IF1 indicate that cells overexpressing IF1 display a less aggressive behavior than IF1 silenced (shIF1) cells. Proteomic and functional in vitro migration and invasion assays confirmed the higher tumorigenic potential of shIF1 cells. Moreover, shIF1 cells have increased in vivo metastatic potential. The higher metastatic potential of shIF1 cells relies on increased cFLIP-mediated resistance to undergo anoikis after cell detachment. Furthermore, tumor spheroids of shIF1 cells have an increased ability to escape from immune surveillance by NK cells. Altogether, the results reveal that the overexpression of IF1 acts as a tumor suppressor in CRC with an important anti-metastatic role, thus supporting IF1 as a potential therapeutic target in CRC.

Keywords: ATPase Inhibitor Factor 1; colorectal cancer; immune surveillance; metastasis; prognosis.


Conflict of interest statement

The authors declare no conflict of interest.

Figures

Figure 1
Figure 1
Expression of IF1 in human colon carcinomas. (A) Representative staining of IF1 expression in normal and tumor tissue of the colon. Magnification 25x. (B) Western blots show IF1 and β-F1-ATPase (β-F1) in paired normal (N) and tumor (T) biopsies derived from three representative patients and increasing amounts of the recombinant IF1 (r-IF1) protein (0–200 ng). Linear correlations between the fluorescence intensity (arbitrary units) of the spots and the amount of recombinant protein. The histogram shows significant differences in the expression of IF1 between the two groups of samples. Protein concentration was calculated according to the fluorescence intensity obtained in r-IF1 plot. The results shown are mean ± S.E.M; *, p < 0.05 when compared to its respective control. (C) Kaplan–Meier curves for disease-free survival probability for the cohort of 37 colon cancer patients stratified by the tumor expression level of IF1. The log-rank test p-value (p < 0.0004) is shown.
Figure 2
Figure 2
Transcriptome of colon cancer IF1-overexpressing and IF1-silenced cells. (A) Representation of the total number of significantly affected genes in the comparisons between four different preparations (1–4) of control, silenced and overexpressing IF1 cells using Agilent 8 × 60K Human arrays. (B) Volcano plot with some relevant genes indicated. X axis represents the expression fold change of the affected genes and the Y axis represents –log10 of the false discovery rate (FDR) values. (C) Gene enrichment analysis, showing the information related to KEGG. (D) Hierarchical clustering analysis using differentially expressed genes implicated in IPA pathways. Four different samples of each cell type were included in the arrays. (E) Quantitative reverse transcription PCR validation of up- and down-regulated genes in the microarray analysis in shIF1 (red bars) and IF1 (green bars) cells. *, p ≤ 0.05 by Student’s t test. (F,G) Pathways (F) and diseases and functions (G) affected by silenced IF1 cells as reveal by the IPA ingenuity tool. Z-score indicates the overall predicted activation/inhibition state of the function.
Figure 3
Figure 3
iTRAQ analysis of two different (1–2) preparations of IF1 and shIF1 cells. (A) Volcano plot of the proteins quantified in iTRAQ analysis. The plot shows the ratio (shIF1/IF1) and significance on the X and Y axes, respectively. (B) Hierarchical clustering analysis based on significant differences in protein expression level between IF1-silenced and overexpressing cells. (C) Pathways affected in shIF1 cells analyzed by Genecodis and Panther. (D) Activated pathway in shIF1 cells analyzed by IPA.
Figure 4
Figure 4
IF1-silenced colon cancer cells have more aggressive phenotype. Cellular proliferation in shIF1 (red lines and bars) and IF1 (green lines and bars) was assessed by protein concentration (n = 3; A) and by the incorporation of EdU (n = 6; B) into cellular DNA. (C) Rates of basal, oligomycin sensitive and maximum respiration in shIF1 and IF1 cells determined in the X24 Seahorse Flux Analyzer (n = 3). OL, oligomycin; DNP, dinitrophenol; R + A, rotenone + antimycin A. (D) Time frames of the wound-healing assay and its quantification (n = 3). Magnification 4x. (E) Anchorage-independent growth in soft-agar and its quantification (n = 4). Magnification 10x. (F) Cell death determination by flow cytometry using Annexin V staining after overnight treatment with 0.25 µM staurosporine (STS) and 60 µM hydrogen peroxide (H2O2) (n = 5). (AF) Results shown are means ± S.E.M; *, p ≤ 0.05 by Student’s t test.
Figure 5
Figure 5
In vivo tumorigenesis and metastasis assays. IF1-silenced and overexpressing HCT116 cells were injected (AC) into the left and right flank of sixteen mice, respectively or (D) into the tail vein of seven mice per condition. (A) Shows bioluminescence imaging of luciferase-positive HCT116 tumors 4 weeks after injection. The graphs show the bioluminescence (B) and tumor volume (C) of shIF1- and IF1-tumors. (D) Bioluminescence imaging of lung metastasis in mice injected with IF1 and shIF1 cells. The histograms show the percentage of mice with metastases, the number of metastases and its bioluminescence. Results shown are means ± S.E.M. IF1, IF1-overexpressing cells are represented by green bars and shIF1, IF1-silencing cells by red bars.
Figure 6
Figure 6
IF1-silenced cells are more resistant to anoikis. (A) Cell viability and cell death induced by anoikis in IF1-overexpressing and shIF1 cells (n = 4). (B) Western blot analysis of the expression of FLIP in two replicates of IF1 silenced and overexpressing cells (n = 4). (C) Western blot analysis of the expression of FLIP in paired normal (N) and tumor (T) biopsies derived from three CRC patients. Results shown are means ± S.E.M; *, p ≤ 0.05 by Student’s t test.
Figure 7
Figure 7
IF1-silenced colon cancer spheroids were more resistant to NK cells invasion and cytotoxicity. (A) Bright field microscopy of IF1-overexpressing and IF1-silenced spheroids without NK cells (upper panels) and confocal microscopy images (middle panels) from IF1-overexpressing and IF1-silenced spheroids co-cultured for 48 h with CD45-APC stained NK cells. Lower panels are a zoom of the indicated area in middle panels. Nuclei: blue, DAPI staining; CD45+ cells: red. Histograms show the quantification of CD45+ cells/mm2 by immunofluorescence microscopy (n = 5) (A) and CD45+ cells/spheroid by flow cytometry (B). For flow cytometry, results shown are means of eight IF1-overexpressing or IF1-silenced spheroids ± S.E.M. (C) Confocal microscopy images of lytic NK-immunological synapses. Nuclei: blue; CD45+ cells: red; Granzyme B: green. (D) Colon cancer cytotoxicity by NK cells was assessed by quantification of phospho-p53 staining (green) by confocal microscopy. Two representative preparations (Sph1 and Sph2) are shown for IF1-overexpressing and IF1-silenced spheroids co-cultured with NK cells for 48 h. Histogram shows the quantification of p-p53+ cells/mm2 (n = 4). *, p ≤ 0.05 by Student’s t test. IF1, IF1-overexpressing cells are represented by green bars and shIF1, IF1-silenced cells by red bar. (E) Hypothetical scheme based on transcriptomic data (Table S6) showing the increased expression of the CXC chemokine receptor 4 (CXCR4, three fold, FDR < 0.005), transcription factor SMAD3 (two fold, FDR < 0.04), ecto- 5’nucleotidase CD73/NT5E (three fold, FDR < 0.005) and LDHA (two fold, FDR < 0.007) in shIF1 cells that might contribute to lessening immune surveillance. Adenosine and lactate in the microenvironment contribute to immunometabolic suppression (red) whereas CXCR4 signaling inhibits activation and proliferation of NK cells (blue).

Similar articles

Cited by

References

    1. Miller K.D., Nogueira L., Mariotto A.B., Rowland J.H., Yabroff K.R., Alfano C.M., Jemal A., Kramer J.L., Siegel R.L. Cancer treatment and survivorship statistics, 2019. CA Cancer J. Clin. 2019;69:363–385. doi: 10.3322/caac.21565. - DOI - PubMed
    1. Hsu P.P., Sabatini D.M. Cancer cell metabolism: Warburg and beyond. Cell. 2008;134:703–707. doi: 10.1016/j.cell.2008.08.021. - DOI - PubMed
    1. Danhier P., Banski P., Payen V.L., Grasso D., Ippolito L., Sonveaux P., Porporato P.E. Cancer metabolism in space and time: Beyond the Warburg effect. Biochim. Biophys. Acta. 2017;1858:556–572. doi: 10.1016/j.bbabio.2017.02.001. - DOI - PubMed
    1. Sanchez-Arago M., Formentini L., Cuezva J.M. Mitochondria-mediated energy adaption in cancer: The H(+)-ATP synthase-geared switch of metabolism in human tumors. Antioxid. Redox Signal. 2013;19:285–298. doi: 10.1089/ars.2012.4883. - DOI - PMC - PubMed
    1. Chandel N.S. Evolution of mitochondria as signaling organelles. Cell Metab. 2015;22:204–206. doi: 10.1016/j.cmet.2015.05.013. - DOI - PubMed