. 2019 Dec 20;21(1):60.
doi: 10.3390/ijms21010060.

DRG2 Deficient Mice Exhibit Impaired Motor Behaviors with Reduced Striatal Dopamine Release

Affiliations

DRG2 Deficient Mice Exhibit Impaired Motor Behaviors with Reduced Striatal Dopamine Release

Hye Ryeong Lim et al. Int J Mol Sci. .

Abstract

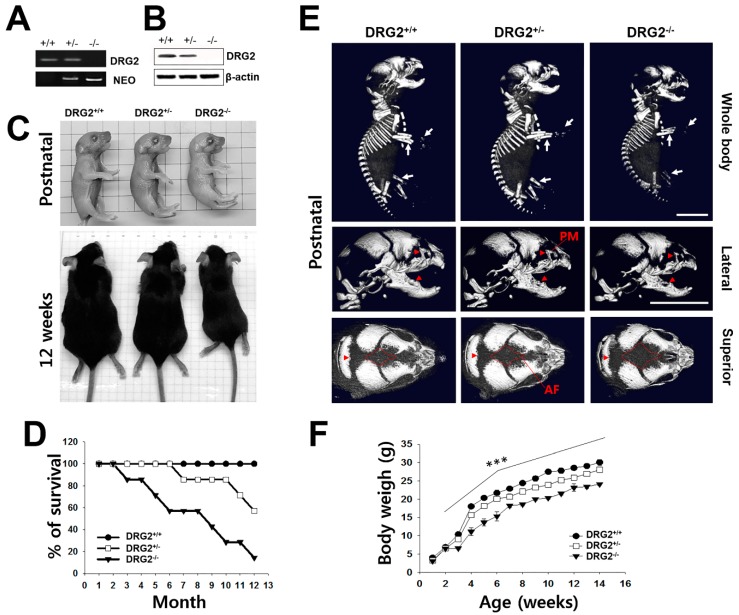
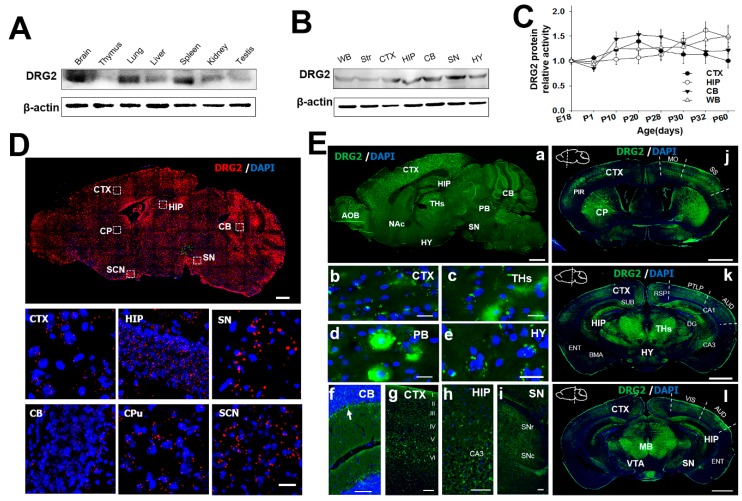
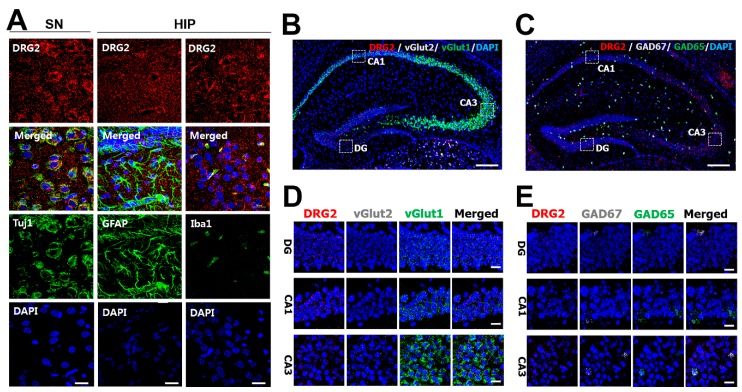
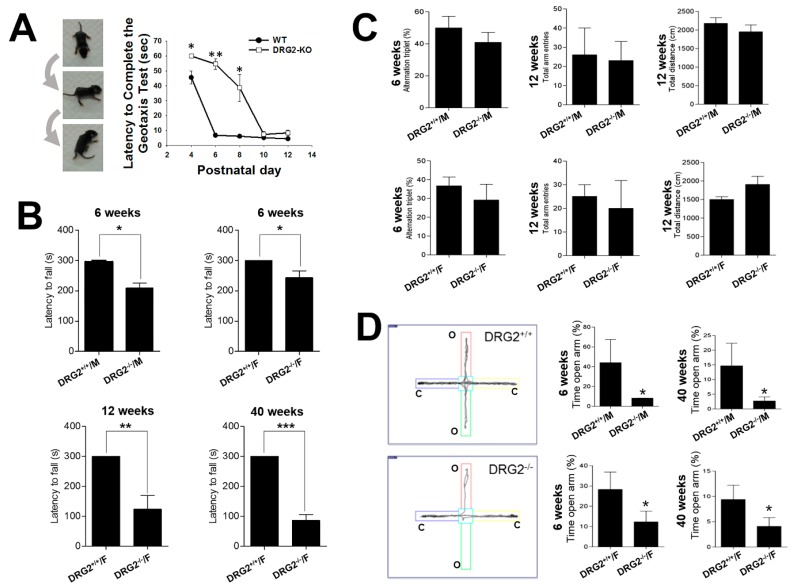
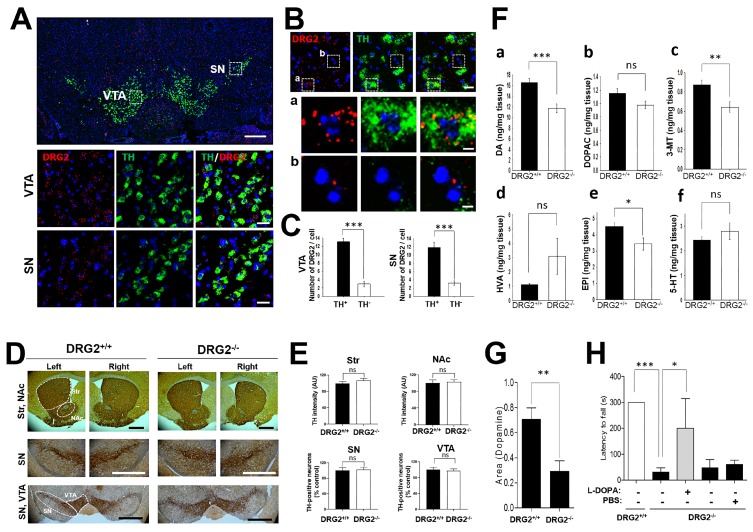
Developmentally regulated GTP-binding protein 2 (DRG2) was first identified in the central nervous system of mice. However, the physiological function of DRG2 in the brain remains largely unknown. Here, we demonstrated that knocking out DRG2 impairs the function of dopamine neurons in mice. DRG2 was strongly expressed in the neurons of the dopaminergic system such as those in the striatum (Str), ventral tegmental area (VTA), and substantia nigra (SN), and on neuronal cell bodies in high-density regions such as the hippocampus (HIP), cerebellum, and cerebral cortex in the mouse brain. DRG2 knockout (KO) mice displayed defects in motor function in motor coordination and rotarod tests and increased anxiety. However, unexpectedly, DRG2 depletion did not affect the dopamine (DA) neuron population in the SN, Str, or VTA region or dopamine synthesis in the Str region. We further demonstrated that dopamine release was significantly diminished in the Str region of DRG2 KO mice and that treatment of DRG2 KO mice with l-3,4-dihydroxyphenylalanine (L-DOPA), a dopamine precursor, rescued the behavioral motor deficiency in DRG2 KO mice as observed with the rotarod test. This is the first report to identify DRG2 as a key regulator of dopamine release from dopamine neurons in the mouse brain.

Keywords: Developmentally regulated GTP-binding protein 2 (DRG2); Dopamine release; Dopaminergic neurons; Motor coordination; Motor deficiency; Striatum.


Conflict of interest statement

These authors declare no conflicts of interest.

Figures

Figure 1
Figure 1
Multiple phenotypic characterization of DRG2 knock out (KO) mice. (A,B) Confirmation of DRG2 deficiency. Expression levels of DRG2 in the cerebral cortex was determined by (A) RT-PCR and (B) western blot analysis. NEO, the primer set of PGK-neo cassette targeting vector for the DRG2 KO mice. (C) Comparison of body size of DRG2−/− mice with DRG2+/+, and DRG2+/− littermates at postnatal day 1 (top) and 12 weeks (bottom). (D) Survival curve for DRG2+/+, DRG2+/−, and DRG2−/− mice. n = 12 per each group. (E) Micro-CT scan images of DRG2+/+, DRG2+/−, and DRG2−/− at postnatal day 1. Top, whole body; middle, lateral views of mice skulls; bottom, superior views of mice skulls. Arrowheads indicate reduced mineralization and arrows show reduction in the radius and ulna of the forelimb and hindlimb in DRG2−/− mice. DRG2−/− mice showed increased anterior fontanel (AF) and reduced premaxillary-maxillary (PM). Scale bar, 500 μm. (F) Body weight of DRG2+/+, DRG2+/−, and DRG2−/− mice. n = 12 per each group. One-way ANOVA: *** p < 0.001. Error bars indicate SEM.
Figure 2
Figure 2
Expression profiling of DRG2 in the mouse brain. (A) Western blot analysis for DRG2 protein tissue distribution. (B) Western blot analysis for DRG2 expression in mouse brain regions. (C) Changes in DRG2 protein expression with age in the four brain regions such as CTX, cerebral cortex; HIP, hippocampus; CB, cerebellum and WB, whole brain. DRG2 expression was normalized to actin. Each data point represents the mean ±SEM (n = 6). (D) In situ hybridization analysis of DRG2 expression in the mouse brain. Sagittal sections of adult mouse brain were hybridized with DRG2 antisense probes. Representative images for DRG2 mRNA (red dots) and nuclei counterstained with DAPI (blue). The boxed regions were viewed at higher magnification in the bottom panels. Scale bar 1 mm. (E) Immunohistochemical analysis of DRG2 expression in the sagittal and coronal sections of mouse adult brain using anti-DRG2 primary antibody and Alexa-488-labeled secondary antibodies. Nuclei were stained with DAPI. (a) Sagittal sections of mouse brain. (bi) Higher magnification of specific regions within sagittal image in (a): (b) CTX, (c) THs, thalamus (d) PB, parabrachial nucleus (e) HY, hypothalamus (f) CB, (g) CTX, (h) HIP, and (i) SN. Arrow in (f) indicates the purkinje cell layer. Scale bar, 100 μm. (jl) Coronal sections of mouse brain at three different planes. Sagittal diagrams of the brain showing the plane of section were indicated within each images. AOB, accessory olfactory bulb; AUD, auditory areas; BMA, basomedial amygdala nuclear; CA1, cornu ammonis1; CA3, Cornu Ammonis3; DG, dentate gyrus; CB, cerebellum; CP, caudate putamen; CTX, cerebral cortex; ENT, Entorhinal area; HIP, hippocampus; HY, hypothalamus; MB, mid brain; Mo, somatomotor area; NAc, nucleus accumbens; PB, parabrachial nucleus; Pir, piriform cortex; PTLP, posterior parietal association areas; RSP, retrosplenial area; SCN, suprachiasmatic nucleus; SN, substantia nigra; SNc, substantia nigra pars compacta; SNr, substantia pars reticulate; SS, somatosensory area; Str, striatum; SUB, subiculum; THs, thalamus; VIS, visual area; VTA, ventral tegmental area; WB, whole brain.
Figure 3
Figure 3
The expression profiling of DRG2 in the mouse neurons. (A) Immunohistochemical staining of neuronal marker Tuj1, astrocytes marker GFAP, microglia marker Iba1, and DRG2 in neuron cell bodies of substantia nigra (SN) and dentate gyrus (DG) of the hippocampus (HIP). Nuclei were stained with DAPI. Scale bar, 20 μm. (BE) In situ hybridization analysis of DRG2 expression in mouse hippocampus. (B,C) Hippocampal sections of mouse brain were hybridized with antisense probes against vGlut2, GAD67 (gray dot), vGlut1, GAD65 (green dot), and DRG2 (red dot). Nuclei were stained with DAPI. Scale bar, 200 μm. The boxed regions in images of (B,C) were viewed at a higher magnification in the bottom panels (D,E), respectively. CA1 and CA3, Cornu Ammonis 1 and 3. Scale bar 20 μm.
Figure 4
Figure 4
Behavioral impairments in DRG2 deficient mice. (A) Geotaxis test. (Left) series of photographs illustrating a mouse performing the geotaxis test. (Right) Graphs based on the latency to complete the geotaxis test in seconds (mean ± SEM, maximum 60 s, n = 8 per each group). * p < 0.05, ** p < 0.005. (B) Rotarod test. DRG2+/+ and DRG2−/− and mice were compared at six, 12, and 40 weeks of age. At six weeks, both female and male mice were compared. At 12 and 40 weeks, female mice were compared. Data represent latency to fall (means ± SEM, maximum 300 s, n = 8 per each group). * p < 0.05, ** p < 0.005, *** p < 0.001. Student’s t-test. (C) Y-maze test. Both female and male of DRG2+/+ and DRG2−/− mice were compared at six and 12 weeks of age. (Left) Percentage of alternation triplet; middle, total number of arm entries; (right) total distance. Data represent means ± SEM (n = 8 each group). (D) Elevated plus maze test. Both female and male of DRG2+/+ and DRG2−/− mice were compared at 6 and 40 weeks of age. Left, representative images showing typical examples of DRG2+/+ and DRG2−/− mice exploring in the elevated plus maze apparatus. (Middle and right), graphs based on the percentage of time spent in the open arms. Data represent means ± SEM (n = 8 per each group). * p < 0.05.
Figure 5
Figure 5
DRG2 deficient mice show decreased release of nigrostriatal dopamine. (A) In situ hybridization analysis of DRG2 and tyrosine hydroxylase (TH) expression in mouse mid brain. Coronal sections of adult mouse brain were hybridized with antisense probes against DRG2 (red) and TH (green). Nuclei were stained with DAPI. (Top) representative images for DRG2 and TH. Scale bar, 500 μm. (Middle and bottom) The boxed regions in the ventral tegmental area (VTA) and substantia nigra (SN) of the top panel were viewed at higher magnification in the middle and bottom panels, respectively. Scale bars, 20 μm. (B) Expression of DRG2 in TH-positive and -negative cells in the VTA region. (Top) In situ hybridization analysis of DRG2 and TH expression in the mouse VTA region. Scale bars, 20 μm. (Middle and bottom) The boxed regions in (a) TH-positive and (b) TH-negative cells of the top panel were viewed at higher magnification in the (a) middle and (b) bottom panels, respectively. Scale bars, 5 μm. (C) Numbers of DRG2 mRNA dots on the TH-positive or -negative cells in the SN and VTA region of (B) were quantified. Data represent the means ± SEM (n = 8 per each group). *** p < 0.0001. (D) Immunohistochemical staining for the TH neuron in Str, SN, NAc and VTA of 1-year old DRG2+/+ and DRG2−/− mice. The dot area indicates the quantification regions. Scale bars, 500 μm. (E) Quantification of TH neurons in the images of (D). Graphs data represents relative TH staining intensity in the Str and NAc and number of TH positive neuron in the SN and VTA. Values obtained from DRG2+/+ mice were set to 100. Student’s t-test; ns, not significant. (F) HPLC analysis for striatal (a) dopamine, (b) 3,4-dihydroxyphenylacetic (DOPAC), (c) 3-methoxytyramine (3-MT), (d) homovanillic acid (HVA), (e) epinephrine (EPI), and (f) serotonin (5-HT) levels of DRG2+/+ and DRG2−/− mice. Data represent means ± SEM (n = 8 per each group). ** p < 0.005, *** p < 0.001. (G) Fast-scan cyclic voltammetry (FSCV) analysis for dopamine release in the striatal slice. In the coronal brain slices, dopamine release was evoked by a single electrical stimulus pulse, and the extracellular dopamine concentration in the striatum was measured using FSCV. Data represent the area under the dopamine concentration curve (means ± SEM, n = 3 per each group). ** p < 0.001. (H) Effect of L-DOPA administration on the motor behavior of DRG2−/− mice. DRG2−/− mice were i.p. injected with L-DOPA (50 mg/kg) and tested on a rotating rod. Data represent the latency time to fall in the rotarod test (means ± SEM, maximum 300 s, n = 6 per each group). * p < 0.05, *** p < 0.001.

Similar articles

Cited by

References

    1. Grace A.A. Dysregulation of the dopamine system in the pathophysiology of schizophrenia and depression. Nat. Rev. Neurosci. 2016;17:524–532. doi: 10.1038/nrn.2016.57. - DOI - PMC - PubMed
    1. Birtwistle J., Baldwin D. Role of dopamine in schizophrenia and Parkinson’s disease. Br. J. Nurs. 1998;7:832–841. doi: 10.12968/bjon.1998.7.14.5636. - DOI - PubMed
    1. Dunlop B.W., Nemeroff C.B. The role of dopamine in the pathophysiology of depression. Arch. Gen. Psychiatry. 2007;64:327–337. doi: 10.1001/archpsyc.64.3.327. - DOI - PubMed
    1. Liang Y., Li S., Wen C., Zhang Y., Guo Q., Wang H., Su B. Intrastriatal injection of colchicine induces striatonigral degeneration in mice. J. Neurochem. 2008;106:1815–1827. doi: 10.1111/j.1471-4159.2008.05526.x. - DOI - PubMed
    1. Yang Y., Zhang K., Zhong J., Wang J., Yu Z., Lei X., Chen X., Quan Y., Xian J., Chen Y., et al. Stably maintained microtubules protect dopamine neurons and alleviate depression-like behavior after intracerebral hemorrhage. Sci. Rep. 2018;8:12647. doi: 10.1038/s41598-018-31056-7. - DOI - PMC - PubMed

Substances