. 2019 Dec 20;9(1):2.
doi: 10.3390/biology9010002.

Impact Effect of Methyl Tertiary-Butyl Ether "Twelve Months Vapor Inhalation Study in Rats"

Affiliations

Impact Effect of Methyl Tertiary-Butyl Ether "Twelve Months Vapor Inhalation Study in Rats"

Osama M Sarhan et al. Biology (Basel). .

Abstract

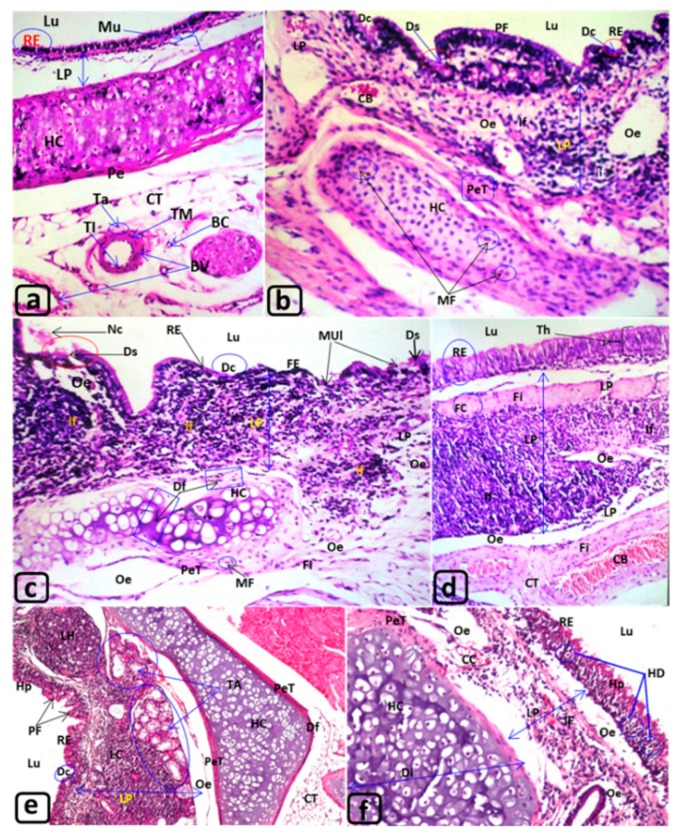
We investigated the early risk of developing cancer by inhalation of low doses (60 µL/day) of methyl tertiary butyl ether (MTBE) vapors using protein SDS-PAGE and LC-MS/MS analysis of rat sera. Furthermore, histological alterations were assessed in the trachea and lungs of 60 adult male Wistar rats. SDS-PAGE of blood sera showed three protein bands corresponding to 29, 28, and 21 kDa. Mass spectroscopy was used to identify these three bands. The upper and middle protein bands showed homology to carbonic anhydrase 2 (CA II), whereas the lower protein band showed homology with peroxiredoxin 2. We found that exposure to MTBE resulted in histopathological alterations in the trachea and the lungs. The histological anomalies of trachea and lung showed that the lumen of trachea, bronchi, and air alveoli packed with free and necrotic epithelial cells (epithelialization). The tracheal lamina propria of lung demonstrated aggregation of lymphoid cells, lymphoid hyperplasia, hemorrhage, adenomas, fibroid degeneration, steatosis, foam cells, severe inflammatory cells with monocytic infiltration, edema, hemorrhage. Occluded, congested, and hypertrophied lung arteries in addition, degenerated thyroid follicles, were observed. The hyaline cartilage displayed degeneration, deformation, and abnormal protrusion. In conclusion, our results suggest that inhalation of very low concentrations of the gasoline additive MTBE could induce an increase in protein levels and resulted in histopathological alterations of the trachea and the lungs.

Keywords: LC-MS/MS analysis; MTBE; cancer biomarker; histopathology.


Conflict of interest statement

The authors declare no conflict of interest in the assessment of results from this experiment.

Figures

Figure 1
Figure 1
T. S., Trachea of the rat: (a) G1 “control”; (bd) G2 exposed for 3 months; (e,f) G3 exposed for 6 months. H&E. (Table 2). Lu: Lumen of control trachea clear from abnormal secretion of any cellular debris. RE: The lining tissue called mucosa (Mu), formed of respiratory epithelium (RE) and the underneath connective tissue, lamina propria (LP). HC, CT and BV: The submucosal layer involved hyaline cartilage (HC) that covered with perichondrium (Pe) sheath and the peritracheal CT surrounded the trachea with numerous blood vessels (BV) that showed normal tunica intima (TI), tunica media (muscularis) (TM), and tunica adventitia (Ta) consisted of substantial sheath of CT, as well as normal blood capillaries (BC). BV: blood vessel; CT: peritracheal connective tissue; HC: hyaline cartilage; LP: lamina propria; Lu: lumen of trachea; RE: respiratory epithelium. Magnifications ×40. H&E. Figure 1b–d: trachea of rats (G2) exposed to MTBE at 60 µL/3 min/day, for 3 months. Figure 1b–d: Lu: Lumen (Lu) showed the presence of eosinophilic debris formed from the necrotic epithelial cells (Nc), Figure 1c. RE: The respiratory epithelium (RE) displayed deciliation (Dc), desquamation (Ds), polyp’s formation (PF) mucosal ulceration (MUl), which deformed into flattened squamous epithelium (FE) “metaplasia” (Figure 1b,c) and/or thickening (Th) “hyperplasia” (Figure 1d). LP: demonstrated congested blood vessel (CB); diffuse accumulation of inflammatory cells infiltrations (If), edema (Oe) (Figues 1b–d), as well as, fibroid changes (Fi) with the presence of few foam cells (FC) (Figure 1d). HC: indicated mitotic figures (MF) with thickened perichondrium (PeT) (Figure 1b) and deformation (Df) (Figure 1c). CT and BV: the peritracheal CT illustrated fibroid changes (Fi) besides severs dilatation and congestion of some blood vessels (CB). Magnifications (Figure 1b–d: ×40). H&E. Figure 1e,f: trachea of rats (G3) exposed to MTBE at 60 µL/3 min/day, for 6 months. Lu: showed, also, the presence of eosinophilic debris and necrotic epithelial cells, but not shown in the present Figure 1e,f. RE: showed deciliation (Dc), hyperplasia (Hp), polyp’s formation (PF) (Figure 1e), and hydropic degeneration (HD) (Figure 1f). LP: more alteration was observed such as: aggregation of lymphoid cells (LC), lymphoid hyperplasia, and accretion of tracheal adenomas (TA) (Figure 1e) and edema (Oe) (Figure 1e,f) with dilatation and congestion in the blood capillaries (CC) (Figure 1f). HC: LP: more alteration was observed such as: aggregation of lymphoid cells (LC), lymphoid hyperplasia, and accretion of tracheal adenomas (TA) (Figure 1e) and edema (Oe) (Figure 1e,f) with dilatation and congestion in the blood capillaries (CC) (Figure 1f). presented deformation (Df) due to outward protrusion with perichondrial thickening (PeT) (Figure 1e,f) and increased its diameter (Figure 1f). CT and BV: The peritracheal CT showed the same alteration observed in Figure 1b–d, not shown in the present Figure 1e,f. Magnifications (Figure 1e, ×16 and 1f ×40), H&E.
Figure 2
Figure 2
T. S., Trachea of the rat: (a–f) G4 exposed for 12 months. H&E. (Table 2). Figure 2a–f: trachea of rats (G4) exposed to MTBE at 60 µL/3 min/day, for 12 months. Lu: illustrated epithelialization (Epi) and necrotic cells (NC) (Figure 2a,b,d–f). RE: showed severe desquamations (Ds) and mucosal ulceration (MUl) (Figure 2a,d,e), degeneration (DE) and hypertrophy (HT) (Figure 2e), and hyperplasia (HP) (Figure 2b,c) or flattened epithelia (FE) “metaplasia” (Figure 2b,d,f). LP: showed increase in size (Figure 2a–f: see bi-head arrow), focal hemorrhage (H) (Figure 2a,f), diffuse hemorrhage (DH) (Figure 2b–e), edema (Oe) (Figure 2a–d,f), fibroid changes (Fi) and inflammatory cells infiltrations (If) (Figure 2a–f), lymphocytic cell infiltration (LC) (Figure 2d), lymphoid hyperplasia (LH) (Figure 2f), furthermore, a small necrotic area (Ne) (Figure 2b,c), fatty degeneration (FD) (Figure 2d,e) with fibroid changes (Fi) (Figure 2a–d,f) and aggregation of plasma cells (P) (Figure 2c). Also, the LP revealed the formation of tracheal adenomas (TA) (Figure 2a,b,d,e) and some of them fused or grown to form large filled fluid large acini (Ac) (Figure 2a,d–f), with metaplasia (Mp) in their walls (Figure 2d). HC: revealed an increase in diameter (Di) or enlarged and protruded (PC) toward the outer and inner directions, but, the cartilage of other trachea displayed deformation (DF) and degeneration (DHC) with the presence of numerous chondroclasts (Ch), which may induce degeneration. CT, BVand T: The peritracheal CT, showed edema (Oe), fibroid degeneration (Fi) (Figure 2a,b) with fibrocytes (Figure 2a), dilated and congested blood vessels (CB) (Figure 2a,b), in addition, inflammatory cells infiltrations (If) and monocytic infiltration (M) (Figure 2a). T: The thyroid the thyroid gland (T) showed few degenerated thyroid follicles (DT) with congested blood vessels (CB) (Figure 2a). Magnifications (Figure 2a ×40; 2b ×16; 2c ×80; 2d–f ×40).
Figure 3
Figure 3
T. S., Lungs of the rat: (a) G1 “control”; (b,c) G2 exposed for 3 months; (df) G3 exposed for 6 months. H&E. (Table 3). Histological alteration in rat lung (Figure 3 and Figure 4). Figure 3a: G1, Lung of control rat. Lu: Normal (clear) lumen of lung bronchi “Br” and normal lumen of air alveoli “AA”. RE: Normal respiratory epithelium RE of lung bronchi. AA: Normal simple squamous epithelia of air alveoli “AA”. CT: Normal connective tissue “CT” of interalveolar septa, peribronchiolar “Pb” and perivascular regions “Pv”. BV, CC: Normal blood vessels “BV” and blood capillaries “CC” of the interalveolar septa, Pb and Pv connective tissues “CT”. Magnifications (Figure 3a), H&E. Figure 3b,c: Lung of rats (G2) exposed to MTBE at 60 µL/3 min/day, for 3 months. Lu: The lumen of some air alveoli was dilated (DA) with focal hemorrhage “H” (Figure 3c). RE: The respiratory epithelia of air alveoli appeared normal with mild thickening (Figure 3c). AA: The air alveoli “AA” showed dilatation “DA” (Figure 3c) with numerous emphysematous changes “Em” (Figure 3b,c). CT: The connective tissue “CT” of the interalveolar regions showed destructed septa “SD” (Figure 3b,c). Pb and Pv: The connective tissue “CT” of peribronchiolar “Pb” and perivascular “Pv” showed inflammatory cells infiltrations (If) and perivascular fibroid (Fi) changes (Figure 3b,c). BV and CC: The blood vessels illustrated severe dilatation (DV) (Figure 3b), congested blood vessels (CB) (Figure 3b,c), and blood capillaries (CC) (Figure 3c) of some inter-septal “IA” CT of air alveoli. Magnifications (Figure 3b: ×40; 3c: ×80), H&E. Figure 3d–f: Lung of rats (G3) exposed to MTBE at 60 µL/3 min/day, for 6 months. Lu: The lumen of some bronchi displayed severe dilatation “DB” (Figure 3d,e). RE: The respiratory epithelium “RE” of dilated bronchi “DB” appeared de-ciliated “Dc” (Figure 3f), shortening or flattened metaplasia “Mp” (Figure 3d) with polyp formation “PF” (Figure 3e). AA: The air alveoli “AA” demonstrated numerous emphysematous changes “Em” (Figure 3d–f) and degenerated alveoli “Da” (Figure 3d), and some lining epithelia showed polyp’s formation (PF) or flattened epithelium “metaplasia” (Mp) (Figure 3e). CT The CT: of inter alveolar septa and peribronchiolar “Pb” region showed inflammatory cells infiltration “If” (Figure 3d,e), fibroid changes “Fi” (Figure 3d–f), with numerous fibrocytes “F” (Figure 3f) and edema “Oe” (Figure 3d). Pb and Pv: Large lymphoid hyperplasia (LH) (Figure 3d) was observed in the Pb and perivascular Pv regions. BV and CC: The blood vessels “BV” (Figure 3e) in the CT of interalveolar, peribronchiolar regions showed dilated “DV” (Figure 3d), congested blood vessel (CB) and blood capillaries (CC) (Figure 3e,f). Magnifications (Figure 3d: ×16; 3e: ×20 and 3f ×80), H&E.
Figure 4
Figure 4
T. S., Lungs of the rat: (a–f) G4 exposed for 12 months. H&E. (Table 3). Figure 4a–f: Lung of rats (G4) exposed to MTBE at 60 µL/3 min/day, for 12 months. Lu, RE and AA: The lumen of air alveoli in many regions frequently showed collapsed ““CA” (Figure 4a,c–f), dilated “DA” (Figure 4c,d), severe emphysematous changes “SE” due to destruction or loss their septa “SA” (Figure 4d,e), or degenerated alveoli “Da” (Figure 4d,f). The lining respiratory epithelium “RE” of bronchi seemed flattened metaplasia “Mp” (Figure 4c), thickening “Th”, or grown into polyp’s shape “PF” (Figure 4a,b). Also, the lining epithelia of bronchioles and air alveoli “AA” showed epithelialization “Epi” (Figure 4a,c) or disappeared due to degeneration “Da” of numerous alveoli (Figure 4d,f). Moreover, the lung parenchyma presented an abusive case of severe focal abscess with central liquefaction “CL” that was surrounded by pyogenic membrane “PM” (Figure 4f). CT, Pb and Pv: The connective tissues “CT” of LP, the peribronchiolar “Pb” and perivascular “Pv”, and inter-septal perialveolar “Pa” regions packed with dense inflammatory cells infiltrations ‘If” (e.g., Figure 4a–d), lymphoproliferative hyperplasia “LH” (Figure 4a), monocytic infiltration “M” (Figure 4d,e), numerous lipid-laden macrophages “foam cells” “FC” (Figure 4a,b), lung adenoma “LA” (Figure 4c), mitotic figure “MF” (Figure 4d,e), and steatosis “St” (Figure a,b,e), in addition, edema “Oe” (Figure 4d,e), diffuse hemorrhage “DH” (Figure 4d,e,f), fibroid degeneration “Fi” (Figure a,d–f) with fibrocytes “F” (Figure 4a,e). BV and CC: Congested blood vessels “CB” and capillaries “CC” showed in the connective tissues (Figure 4d,e). On the other hand, some of lung arteries appeared hypertrophied “HA” and occluded arterial lumen with hypertrophy “HM” of tunica media “TM” and tunica adventitia “Ad” (Figure 4a,c,e). However, the lining epithelium of the larger blood vessel appeared occluded, the lumen showed desquamation “Ds” (Figure 4a,e), in addition, hypertrophy “HM” of tunica media “TM” and tunica adventitia (Ad). Magnifications (Figure 4b: ×80; 4d: ×16; 4c,e,f: ×40), H&E.
Figure 5
Figure 5
(A) Coomassie blue-stained SDS PAGE of sera. Lane M: protein marker, Lane C: control sample. Lane 1 treated sample after 3 months. Lane 2: treated sample after six months. Lane 3 treated sample after 12 months—Lane 4: treated samples after 12 months. The high, middle and lower band were dissected and subjected to MS analysis. (B) The image of SDS-PAGE gel was obtained by Bio-Rad gel doc system to detect the bands and deference’s between each lane.

Similar articles

Cited by

References

    1. Dodd D., Willson G., Parkinson H., Bermudez E. Two-year drinking water carcinogenicity study of methyl tertiary-butyl ether (MTBE) in Wistar rats. J. Appl. Toxicol. 2013;33:593–606. doi: 10.1002/jat.1776. - DOI - PubMed
    1. Komex, International Ltd. Water Quality Guidelines for Methyl Tertiary Butyl Ether (MTBE) British Colombia Ministry of Environment, Lands & Parks Water Management Branch; Alberta, BC, Canada: 2001.
    1. Johnson R., Pankow J., Bender D., Price C., Zogorski J. MTBE-To what extent will past releases contaminate community water supply wells. Environ. Sci. Technol. 2000;34:210A–217A. doi: 10.1021/es003268z. - DOI - PubMed
    1. White M.C., Johnson C.A., Ashley D.L., Buchta T.M., Pelletier D.J. Exposure to methyl tertiary-butyl ether from oxygenated gasoline in Stamford, Connecticut. Arch. Environ. Health. 1995;50:183–189. doi: 10.1080/00039896.1995.9940385. - DOI - PubMed
    1. Fowler D.R. Master’s Thesis. The Evergreen State College; Olympia, WA, USA: Mar, 2011. An Analysis and Comparison of Methyl Tertiary Butyl Ether’s (MTBE’S) Use as a Fuel Oxygenate against the Tenets of the Precautionary Principle.